

582
2eo
2<0
.......
.......
240
.......
.....
.... .......
g220
'0"""
....
-;
r _ _ _ _ ·•••••S
!
/
° mi.
~200
(
i
i
,
.eo
,
,
'60
1400
10
20
30
40
SO
60
70
eo
90
.roqueney (GHz(
220
1eo
120
.00
eoO ~~.~ O --20 ~-~ 30-~ 40~~ SO~~ 60 ~~70 ~-eo ~~ 90·
lroquoncy (GHz(
J. Noll
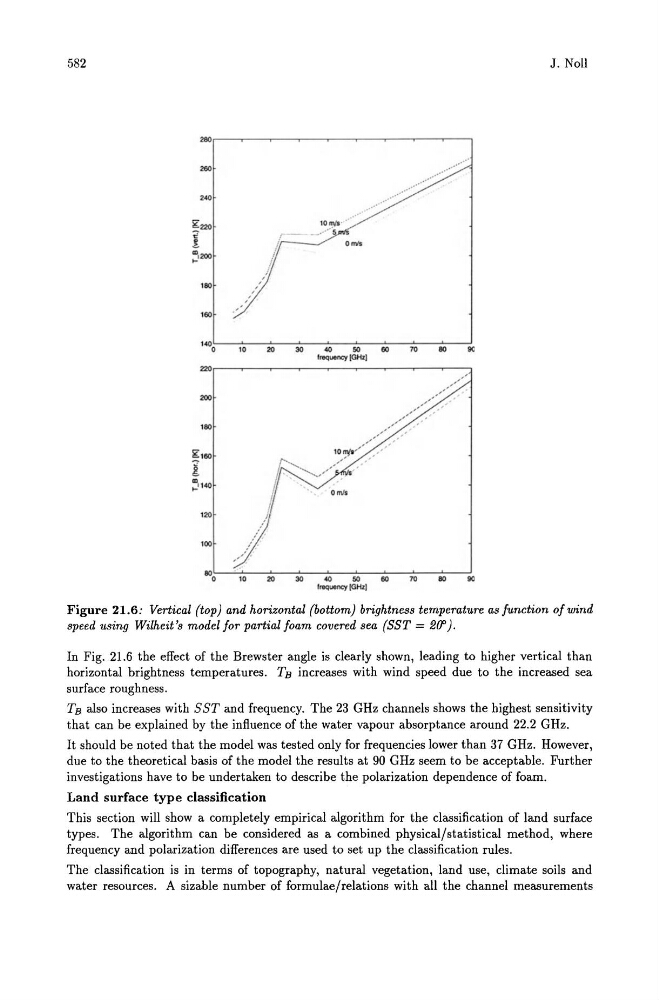
Figure 21.6: Vertical (top) and horizontal (bottom) brightness temperature as function of wind
speed using Wilheit's model for partial foam covered sea (SST = 2(J').
In Fig. 21.6 the effect of the Brewster angle is clearly shown, leading to higher vertical than
horizontal brightness temperatures. TB increases with wind speed due to the increased sea
surface roughness.
TB also increases with SST and frequency. The 23 GHz channels shows the highest sensitivity
that can be explained by the influence of the water vapour absorptance around 22.2 GHz.
It should be noted that the model was tested only for frequencies lower than 37 GHz. However,
due to the theoretical basis of the model the results at 90 GHz seem to be acceptable. Further
investigations have to be undertaken to describe the polarization dependence of foam.
Land surface type classification
This section will show a completely empirical algorithm for the classification of land surface
types. The algorithm can be considered as a combined physical/statistical method, where
frequency and polarization differences are used to set up the classification rules.
The classification is in terms of topography, natural vegetation, land use, climate soils and
water resources. A sizable number of formulae/relations with all the channel measurements