

564
A.D. Del Genio
mission. Although TRMM will produce a 3-year tropical data set with accuracies useful to
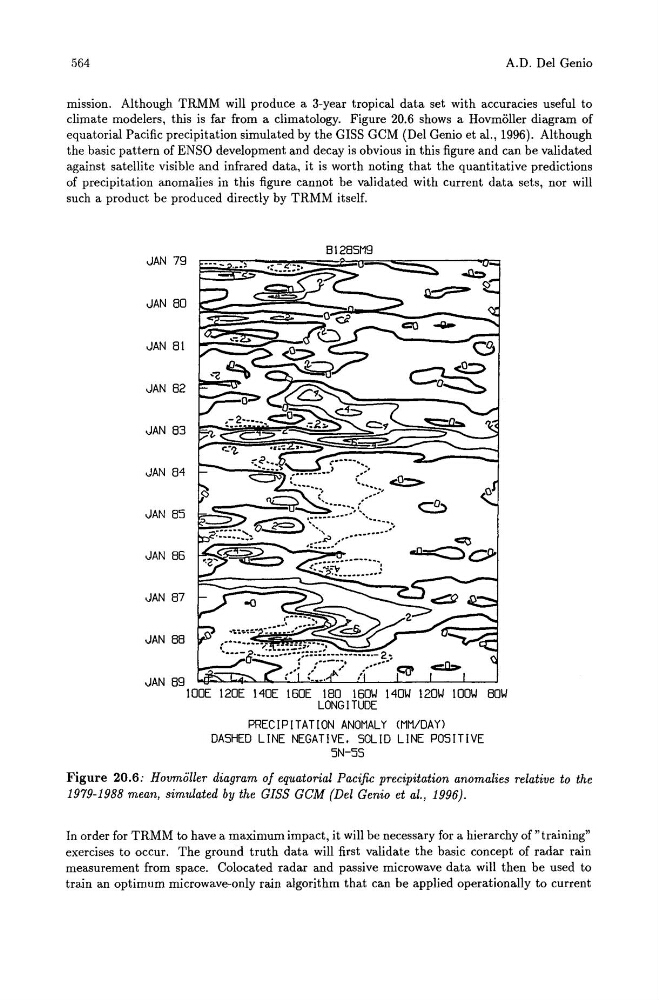
climate modelers, this is far from a climatology. Figure 20.6 shows a Hovmoller diagram of
equatorial Pacific precipitation simulated by the GISS GCM (Del Genio et aI., 1996). Although
the basic pattern of ENSO development and decay is obvious in this figure and can be validated
against satellite visible and infrared data, it is worth noting that the quantitative predictions
of precipitation anomalies in this figure cannot be validated with current data sets, nor will
such a product be produced directly by TRMM itself.
BI28SM9
JAN 79
JAN 80
JAN 81
JAN 82
JAN 83
JAN 84
::;' <£l=>
.... ::: .... ,
JAN 85
C
JAN 86
JAN 87
JAN 88
JAN 89
Inl~I~lnloo IDI~I~I~~
LONGITUDE
PRECIPITATION ANOMALY (MM/DAY)
DASHED LINE NEGATIVE. SOLID LINE POSITIVE
5N-55
Figure 20.6: Hovmoller diagram of equatorial Pacific precipitation anomalies relative to the
1979-1988 mean, simulated by the GISS GeM (Del Genio et al., 1996).
In order for TRMM to have a maximum impact, it will be necessary for a hierarchy of "training"
exercises to occur. The ground truth data will first validate the basic concept of radar rain
measurement from space. Colocated radar and passive microwave data will then be used to
train an optimum microwave-only rain algorithm that can be applied operationally to current