

Applications of Passive and Active Microwave Sensors ...
477
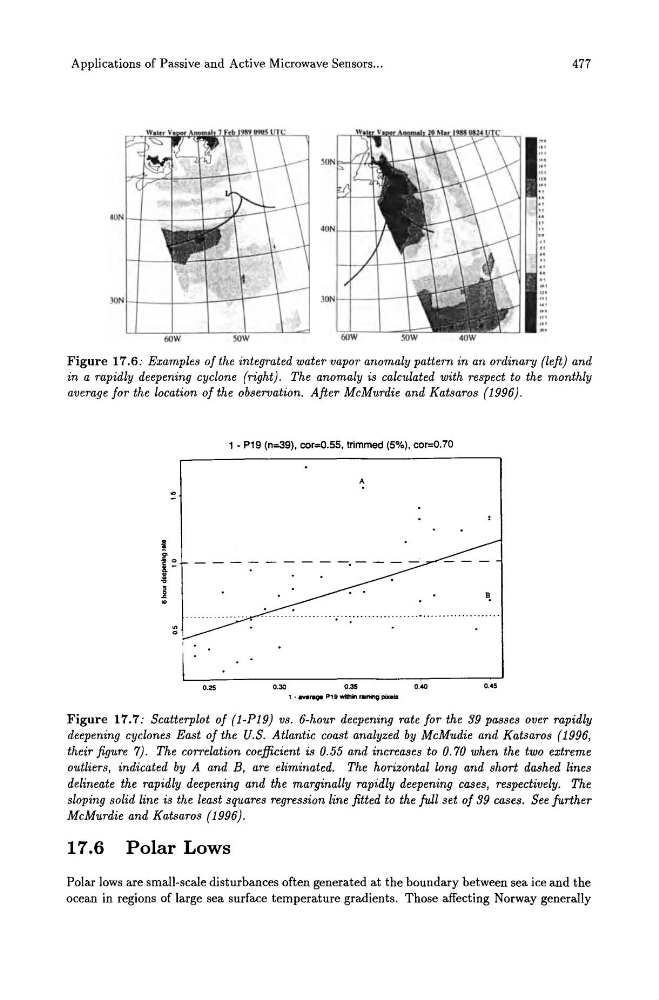
Figure 17.6: Examples of the integrated water vapor anomaly pattern in an ordinary (left) and
in a rapidly deepening cyclone (right). The anomaly is calculated with respect to the monthly
average for the location of the observation. After McMurdie and Katsaros (1996).
1 - P19 (n=39). cor=O.55. trimmed (5%). cor=O.70
0.25
0.30
0.35
0.40
0.45
, • average P19 within raining pixelS
Figure 17.7: Scatterplot of (1-P19) vs. 6-hour deepening rate for the 39 passes over rapidly
deepening cyclones East of the U.S. Atlantic coast analyzed by McMudie and Katsaros (1996,
their figure 7). The correlation coefficient is 0.55 and increases to 0.70 when the two extreme
outliers, indicated by A and B, are eliminated. The horizontal long and short dashed lines
delineate the rapidly deepening and the marginally rapidly deepening cases, respectively. The
sloping solid line is the least squares regression line fitted to the full set of 39 cases. See further
McMurdie and Katsaros (1996).
17.6 Polar Lows
Polar lows are small-scale disturbances often generated at the boundary between sea ice and the
ocean in regions of large sea surface temperature gradients. Those affecting Norway generally
477
Figure 17.6: Examples of the integrated water vapor anomaly pattern in an ordinary (left) and
in a rapidly deepening cyclone (right). The anomaly is calculated with respect to the monthly
average for the location of the observation. After McMurdie and Katsaros (1996).
1 - P19 (n=39). cor=O.55. trimmed (5%). cor=O.70
0.25
0.30
0.35
0.40
0.45
, • average P19 within raining pixelS
Figure 17.7: Scatterplot of (1-P19) vs. 6-hour deepening rate for the 39 passes over rapidly
deepening cyclones East of the U.S. Atlantic coast analyzed by McMudie and Katsaros (1996,
their figure 7). The correlation coefficient is 0.55 and increases to 0.70 when the two extreme
outliers, indicated by A and B, are eliminated. The horizontal long and short dashed lines
delineate the rapidly deepening and the marginally rapidly deepening cases, respectively. The
sloping solid line is the least squares regression line fitted to the full set of 39 cases. See further
McMurdie and Katsaros (1996).
17.6 Polar Lows
Polar lows are small-scale disturbances often generated at the boundary between sea ice and the
ocean in regions of large sea surface temperature gradients. Those affecting Norway generally