

374
S. Paloscia
38
HCMM
6/05/71 0
0
1330 LST
7113/71 0
1/01/71 6
9/04/71 0
0
34
8
0
U
~
0
~
6
0
0
6
30
0
0
o~
0
Y.58.35Xo,1I
,.0.74-26
0
0
20
40
60
80
00
50lL WATER CONTENT (S of F.C.'
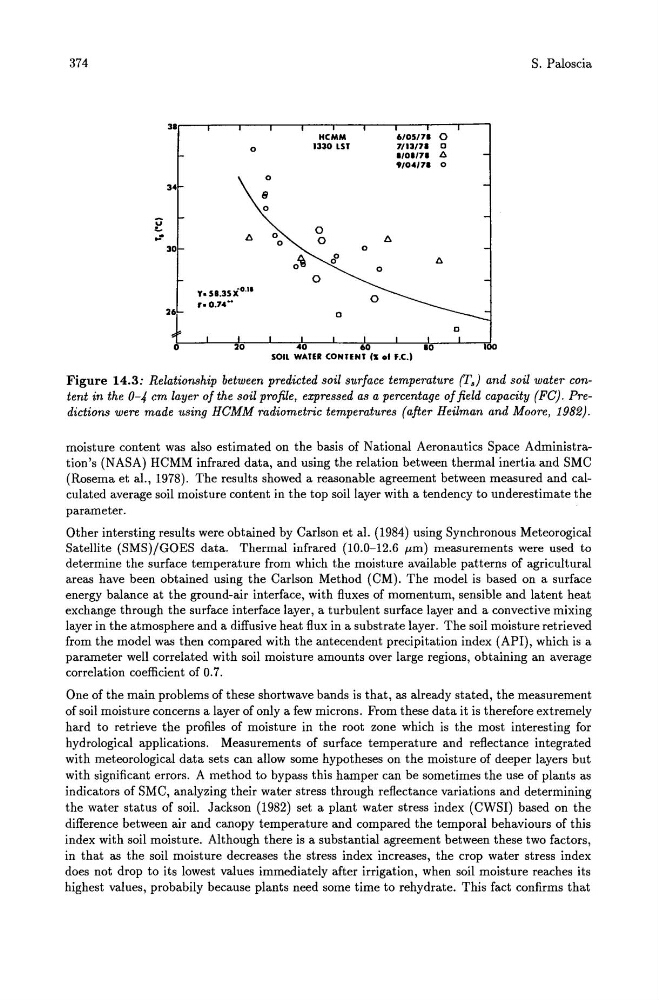
Figure 14.3: Relationship between predicted soil surface temperature (ra) and soil water content in the 0-4 cm layer of the soil profile, expressed as a percentage of field capacity (FC). Predictions were made using HCMM radiometric temperatures (after Heilman and Moore, 1982).
moisture content was also estimated on the basis of National Aeronautics Space Administration's (NASA) HCMM infrared data, and using the relation between thermal inertia and SMC
(Rosema et aI., 1978). The results showed a reasonable agreement between measured and calculated average soil moisture content in the top soil layer with a tendency to underestimate the
parameter.
Other intersting results were obtained by Carlson et al. (1984) using Synchronous Meteorogical
Satellite (SMS)/GOES data. Thermal infrared (10.0-12.6 fIm) measurements were used to
determine the surface temperature from which the moisture available patterns of agricultural
areas have been obtained using the Carlson Method (CM). The model is based on a surface
energy balance at the ground-air interface, with fluxes of momentum, sensible and latent heat
exchange through the surface interface layer, a turbulent surface layer and a convective mixing
layer in the atmosphere and a diffusive heat flux in a substrate layer. The soil moisture retrieved
from the model was then compared with the antecendent precipitation index (API), which is a
parameter well correlated with soil moisture amounts over large regions, obtaining an average
correlation coefficient of 0.7.
One of the main problems of these shortwave bands is that, as already stated, the measurement
of soil moisture concerns a layer of only a few microns. From these data it is therefore extremely
hard to retrieve the profiles of moisture in the root zone which is the most interesting for
hydrological applications. Measurements of surface temperature and reflectance integrated
with meteorological data sets can allow some hypotheses on the moisture of deeper layers but
with significant errors. A method to bypass this hamper can be sometimes the use of plants as
indicators of SMC, analyzing their water stress through reflectance variations and determining
the water status of soil. Jackson (1982) set a plant water stress index (CWSI) based on the
difference between air and canopy temperature and compared the temporal behaviours of this
index with soil moisture. Although there is a substantial agreement between these two factors,
in that as the soil moisture decreases the stress index increases, the crop water stress index
does not drop to its lowest values immediately after irrigation, when soil moisture reaches its
highest values, probabily because plants need some time to rehydrate. This fact confirms that
S. Paloscia
38
HCMM
6/05/71 0
0
1330 LST
7113/71 0
1/01/71 6
9/04/71 0
0
34
8
0
U
~
0
~
6
0
0
6
30
0
0
o~
0
Y.58.35Xo,1I
,.0.74-26
0
0
20
40
60
80
00
50lL WATER CONTENT (S of F.C.'
Figure 14.3: Relationship between predicted soil surface temperature (ra) and soil water content in the 0-4 cm layer of the soil profile, expressed as a percentage of field capacity (FC). Predictions were made using HCMM radiometric temperatures (after Heilman and Moore, 1982).
moisture content was also estimated on the basis of National Aeronautics Space Administration's (NASA) HCMM infrared data, and using the relation between thermal inertia and SMC
(Rosema et aI., 1978). The results showed a reasonable agreement between measured and calculated average soil moisture content in the top soil layer with a tendency to underestimate the
parameter.
Other intersting results were obtained by Carlson et al. (1984) using Synchronous Meteorogical
Satellite (SMS)/GOES data. Thermal infrared (10.0-12.6 fIm) measurements were used to
determine the surface temperature from which the moisture available patterns of agricultural
areas have been obtained using the Carlson Method (CM). The model is based on a surface
energy balance at the ground-air interface, with fluxes of momentum, sensible and latent heat
exchange through the surface interface layer, a turbulent surface layer and a convective mixing
layer in the atmosphere and a diffusive heat flux in a substrate layer. The soil moisture retrieved
from the model was then compared with the antecendent precipitation index (API), which is a
parameter well correlated with soil moisture amounts over large regions, obtaining an average
correlation coefficient of 0.7.
One of the main problems of these shortwave bands is that, as already stated, the measurement
of soil moisture concerns a layer of only a few microns. From these data it is therefore extremely
hard to retrieve the profiles of moisture in the root zone which is the most interesting for
hydrological applications. Measurements of surface temperature and reflectance integrated
with meteorological data sets can allow some hypotheses on the moisture of deeper layers but
with significant errors. A method to bypass this hamper can be sometimes the use of plants as
indicators of SMC, analyzing their water stress through reflectance variations and determining
the water status of soil. Jackson (1982) set a plant water stress index (CWSI) based on the
difference between air and canopy temperature and compared the temporal behaviours of this
index with soil moisture. Although there is a substantial agreement between these two factors,
in that as the soil moisture decreases the stress index increases, the crop water stress index
does not drop to its lowest values immediately after irrigation, when soil moisture reaches its
highest values, probabily because plants need some time to rehydrate. This fact confirms that