

Remote Sensing of Atmospheric Water Vapor
183
..... TI'I..C£ tlXGI
. ;: ;: :::::: . . ,
•• ' •••• ... oD" " ',,0.
-".~:'.:.L ,I,T I n.u (C(G '
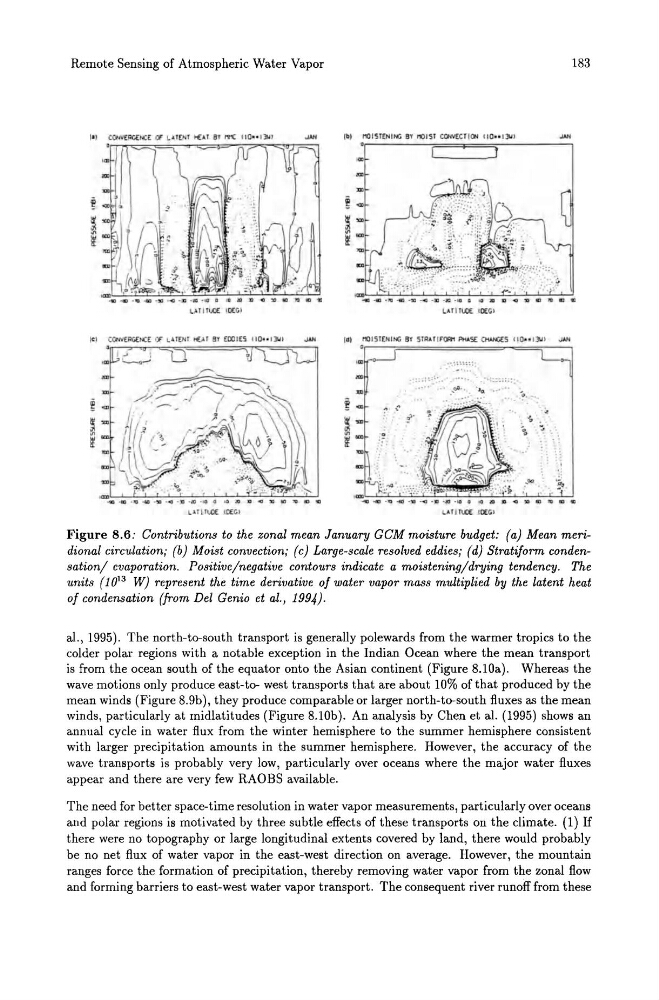
Figure 8.6: Contributions to the zonal mean January GCM moisture budget: (a) Mean meridional circulation; (b) Moist convection; (c) Large-scale resolved eddies; (d) Stratiform condensation/ evaporation. Positive/negative contours indicate a moistening/drying tendency. The
units (10 13 W) represent the time derivative of water vapor mass multiplied by the latent heat
of condensation (from Del Genio et al., 1994).
al., 1995). The north-to-south transport is generally polewards from the warmer tropics to the
colder polar regions with a notable exception in the Indian Ocean where the mean transport
is from the ocean south of the equator onto the Asian continent (Figure 8.10a). Whereas the
wave motions only produce east-to- west transports that are about 10% of that produced by the
mean winds (Figure 8.9b), they produce comparable or larger north-to-south fluxes as the mean
winds, particularly at midlatitudes (Figure 8.10b). An analysis by Chen et al. (1995) shows an
annual cycle in water flux from the winter hemisphere to the summer hemisphere consistent
with larger precipitation amounts in the summer hemisphere. However, the accuracy of the
wave transports is probably very low, particularly over oceans where the major water fluxes
appear and there are very few RAOBS available.
The need for better space-time resolution in water vapor measurements, particularly over oceans
and polar regions is motivated by three subtle effects of these transports on the climate. (1) If
there were no topography or large longitudinal extents covered by land, there would probably
be no net flux of water vapor in the east-west direction on average. However, the mountain
ranges force the formation of precipitation, thereby removing water vapor from the zonal flow
and forming barriers to east-west water vapor transport. The consequent river runoff from these
183
..... TI'I..C£ tlXGI
. ;: ;: :::::: . . ,
•• ' •••• ... oD" " ',,0.
-".~:'.:.L ,I,T I n.u (C(G '
Figure 8.6: Contributions to the zonal mean January GCM moisture budget: (a) Mean meridional circulation; (b) Moist convection; (c) Large-scale resolved eddies; (d) Stratiform condensation/ evaporation. Positive/negative contours indicate a moistening/drying tendency. The
units (10 13 W) represent the time derivative of water vapor mass multiplied by the latent heat
of condensation (from Del Genio et al., 1994).
al., 1995). The north-to-south transport is generally polewards from the warmer tropics to the
colder polar regions with a notable exception in the Indian Ocean where the mean transport
is from the ocean south of the equator onto the Asian continent (Figure 8.10a). Whereas the
wave motions only produce east-to- west transports that are about 10% of that produced by the
mean winds (Figure 8.9b), they produce comparable or larger north-to-south fluxes as the mean
winds, particularly at midlatitudes (Figure 8.10b). An analysis by Chen et al. (1995) shows an
annual cycle in water flux from the winter hemisphere to the summer hemisphere consistent
with larger precipitation amounts in the summer hemisphere. However, the accuracy of the
wave transports is probably very low, particularly over oceans where the major water fluxes
appear and there are very few RAOBS available.
The need for better space-time resolution in water vapor measurements, particularly over oceans
and polar regions is motivated by three subtle effects of these transports on the climate. (1) If
there were no topography or large longitudinal extents covered by land, there would probably
be no net flux of water vapor in the east-west direction on average. However, the mountain
ranges force the formation of precipitation, thereby removing water vapor from the zonal flow
and forming barriers to east-west water vapor transport. The consequent river runoff from these