

Clouds and tht' Radiative Heating ...
157
one measurement. Re-arranging Equation 7.2, the cloud forcing (C F) can also be determined
according to Equation 7.3.
CF = QRAD - Q~AD = CFsw + CFLw
(7.3)
By use of sophisticated scene identification algorithms, taking into account the spectral dependenct' of differing targets within different wavelength bands, it is possible to identify clear-sky
pixels with a very high accuracy. Thus, the application of such a scene identification allows to
estimate on a regional scale, 2.5 0 x 2.5 0 regions for ERBE, over a time period of one month
the average clear-sky net radiation budget Q~e;~. Then, in general, the cloud forcing can be
approximated according to Equation 7.3 by simply taking differences between these monthly
mean clear-sky fluxes ~e;; and the monthly regional mean of the all sky radiation fluxes
Q RAD at the top of the atmosphere. In addition, it is common, as also shown in Equation
7.3, to separate the cloud forcing into a short-wave C Fsw and a long-wave C FLW component,
respecti vely.
In the shortwave range clouds usually reflect more incoming solar radiation than the clear-sky
surfaces. This albedo effect serves to cool the Earth surface-atmosphere system as indicated
in Equation 7.4. In the longwave range, clouds act like a greenhouse gas. They absorb a
large fraction of radiation emitted from the surface at high term perature, but reemit less of
it to space due to the low temperatures at the cloud tops, thus, heating the Earth surfaceatmosphere system as shown in Equation 7.5.
(7.4)
CFLW = -(OLR - OLR clear ) > 0
(7.5)
Date
ClearLongwave Shortwave Netto
Sky
Sky
Cloud
Cloud
Cloud
Longwave Shortwave Forcing
Forcing
Forcing
Absorbed
April 1985
265.8
281.6
31.3
-45.1
-13.8
July 1985
267.6
281.1
30.1
-46.7
-16.6
October 1985
266.3
293.1
32.2
-50.1
-17.9
January 1986
262.5
295.0
:~0.6
-51.7
-21.1
Annual
265.6
287.7
31.1
-48.4
-17.3
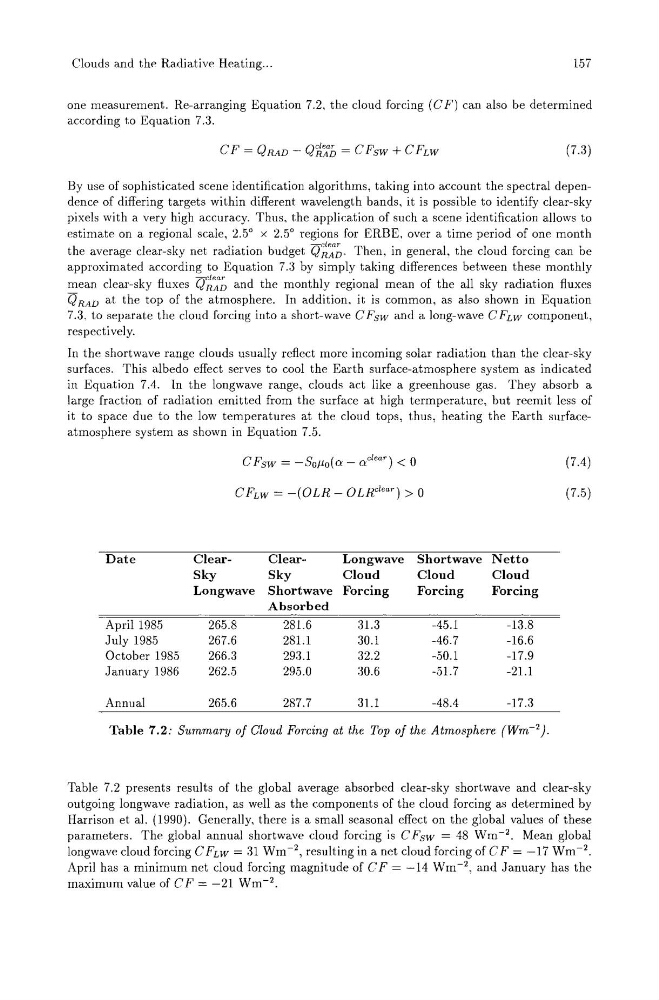
Table 7.2: Summary of Cloud Forcing at the Top of the Atmosphere (Wm- 2 ).
Table 7.2 presents results of the global average absorbed clear-sky shortwave and clear-sky
outgoing longwave radiation, as well as the components of the cloud forcing as determined by
Harrison et al. (1990). Generally, there is a small seasonal effect on the global values of these
parameters. The global annual shortwave cloud forcing is CFsw = 48 Wm- 2 . Mean global
longwave cloud forcing CFLW = 31 Wm- 2 , resulting in a net cloud forcing of C F = -17 Wm- 2 .
April has a minimum net cloud forcing magnitude of CF = -14 Wm- 2 , and January has the
maximum value of C F = -21 Wm- 2 .
157
one measurement. Re-arranging Equation 7.2, the cloud forcing (C F) can also be determined
according to Equation 7.3.
CF = QRAD - Q~AD = CFsw + CFLw
(7.3)
By use of sophisticated scene identification algorithms, taking into account the spectral dependenct' of differing targets within different wavelength bands, it is possible to identify clear-sky
pixels with a very high accuracy. Thus, the application of such a scene identification allows to
estimate on a regional scale, 2.5 0 x 2.5 0 regions for ERBE, over a time period of one month
the average clear-sky net radiation budget Q~e;~. Then, in general, the cloud forcing can be
approximated according to Equation 7.3 by simply taking differences between these monthly
mean clear-sky fluxes ~e;; and the monthly regional mean of the all sky radiation fluxes
Q RAD at the top of the atmosphere. In addition, it is common, as also shown in Equation
7.3, to separate the cloud forcing into a short-wave C Fsw and a long-wave C FLW component,
respecti vely.
In the shortwave range clouds usually reflect more incoming solar radiation than the clear-sky
surfaces. This albedo effect serves to cool the Earth surface-atmosphere system as indicated
in Equation 7.4. In the longwave range, clouds act like a greenhouse gas. They absorb a
large fraction of radiation emitted from the surface at high term perature, but reemit less of
it to space due to the low temperatures at the cloud tops, thus, heating the Earth surfaceatmosphere system as shown in Equation 7.5.
(7.4)
CFLW = -(OLR - OLR clear ) > 0
(7.5)
Date
ClearLongwave Shortwave Netto
Sky
Sky
Cloud
Cloud
Cloud
Longwave Shortwave Forcing
Forcing
Forcing
Absorbed
April 1985
265.8
281.6
31.3
-45.1
-13.8
July 1985
267.6
281.1
30.1
-46.7
-16.6
October 1985
266.3
293.1
32.2
-50.1
-17.9
January 1986
262.5
295.0
:~0.6
-51.7
-21.1
Annual
265.6
287.7
31.1
-48.4
-17.3
Table 7.2: Summary of Cloud Forcing at the Top of the Atmosphere (Wm- 2 ).
Table 7.2 presents results of the global average absorbed clear-sky shortwave and clear-sky
outgoing longwave radiation, as well as the components of the cloud forcing as determined by
Harrison et al. (1990). Generally, there is a small seasonal effect on the global values of these
parameters. The global annual shortwave cloud forcing is CFsw = 48 Wm- 2 . Mean global
longwave cloud forcing CFLW = 31 Wm- 2 , resulting in a net cloud forcing of C F = -17 Wm- 2 .
April has a minimum net cloud forcing magnitude of CF = -14 Wm- 2 , and January has the
maximum value of C F = -21 Wm- 2 .