

116
Y. Fouquart and M. Vesperini
wavenumber, a significant contribution to kv and since the line shape changes very quickly
near the center, this type of model is of course time consuming. In practice, the strongest
lines still have an influence as far as many hundreds of cm- 1 from their center and the sharp
variation of g(v - vol requires integration steps as small as a few hundredth of cm- 1 . The
increasing computing power makes however their use more and more frequent. Band models
which are made of simple physical approximations still remain very useful for a fast approach
of the problems or when we consider very large spectral intervals and repeated calculations as
it is the case in all problems where radiation is considered from the point of view of energy
transfers (e.g. the computation of radiative heating rates in a GeM).
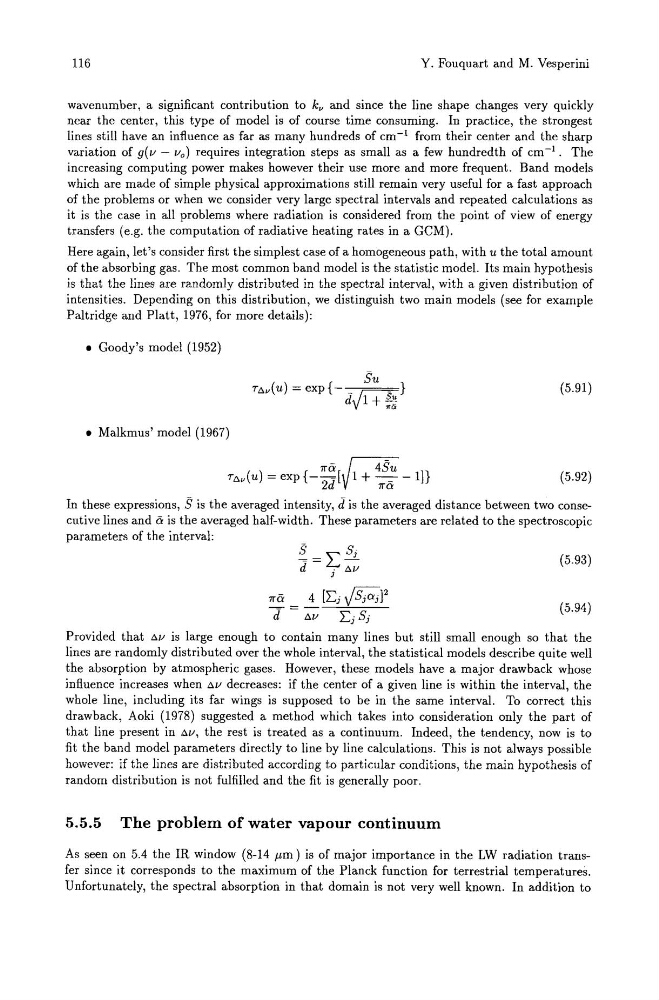
Here again, let's consider first the simplest case of a homogeneous path, with u the total amount
of the absorbing gas. The most common band model is the statistic model. Its main hypothesis
is that the lines are randomly distributed in the spectral interval, with a given distribution of
intensities. Depending on this distribution, we distinguish two main models (see for example
Paltridge and Platt, 1976, for more details):
• Goody's model (1952)
Tt.v(u)=exp{
Su
}
d.J1 + s"
""
(5.91)
• Malkmus' model (1967)
lTa~Su
Tt.v(u)=exp{--[ 1+-_ -In
2d
lTa
(5.92)
In these expressions, S is the averaged intensity, d is the averaged distance between two consecutive lines and a is the averaged half-width. These parameters are related to the spectroscopic
parameters of the interval:
~=LSj
d
j t.v
(5.93)
?fa
4 [Ej VS;;;;12
d = t.v
Ej Sj
(5.94)
Provided that t.v is large enough to contain many lines but still small enough so that the
lines are randomly distributed over the whole interval, the statistical models describe quite well
the absorption by atmospheric gases. However, these models have a major drawback whose
influence increases when t.v decreases: if the center of a given line is within the interval, the
whole line, including its far wings is supposed to be in the same interval. To correct this
drawback, Aoki (1978) suggested a method which takes into consideration only the part of
that line present in t.v, the rest is treated as a continuum. Indeed, the tendency, now is to
fit the band model parameters directly to line by line calculations. This is not always possible
however: if the lines are distributed according to particular conditions, the main hypothesis of
random distribution is not fulfilled and the fit is generally poor.
5.5.5 The problem of water vapour continuum
As seen on 5.4 the IR window (8-14 pm) is of major importance in the LW radiation transfer since it corresponds to the maximum of the Planck function for terrestrial temperatures.
Unfortunately, the spectral absorption in that domain is not very well known. In addition to
Y. Fouquart and M. Vesperini
wavenumber, a significant contribution to kv and since the line shape changes very quickly
near the center, this type of model is of course time consuming. In practice, the strongest
lines still have an influence as far as many hundreds of cm- 1 from their center and the sharp
variation of g(v - vol requires integration steps as small as a few hundredth of cm- 1 . The
increasing computing power makes however their use more and more frequent. Band models
which are made of simple physical approximations still remain very useful for a fast approach
of the problems or when we consider very large spectral intervals and repeated calculations as
it is the case in all problems where radiation is considered from the point of view of energy
transfers (e.g. the computation of radiative heating rates in a GeM).
Here again, let's consider first the simplest case of a homogeneous path, with u the total amount
of the absorbing gas. The most common band model is the statistic model. Its main hypothesis
is that the lines are randomly distributed in the spectral interval, with a given distribution of
intensities. Depending on this distribution, we distinguish two main models (see for example
Paltridge and Platt, 1976, for more details):
• Goody's model (1952)
Tt.v(u)=exp{
Su
}
d.J1 + s"
""
(5.91)
• Malkmus' model (1967)
lTa~Su
Tt.v(u)=exp{--[ 1+-_ -In
2d
lTa
(5.92)
In these expressions, S is the averaged intensity, d is the averaged distance between two consecutive lines and a is the averaged half-width. These parameters are related to the spectroscopic
parameters of the interval:
~=LSj
d
j t.v
(5.93)
?fa
4 [Ej VS;;;;12
d = t.v
Ej Sj
(5.94)
Provided that t.v is large enough to contain many lines but still small enough so that the
lines are randomly distributed over the whole interval, the statistical models describe quite well
the absorption by atmospheric gases. However, these models have a major drawback whose
influence increases when t.v decreases: if the center of a given line is within the interval, the
whole line, including its far wings is supposed to be in the same interval. To correct this
drawback, Aoki (1978) suggested a method which takes into consideration only the part of
that line present in t.v, the rest is treated as a continuum. Indeed, the tendency, now is to
fit the band model parameters directly to line by line calculations. This is not always possible
however: if the lines are distributed according to particular conditions, the main hypothesis of
random distribution is not fulfilled and the fit is generally poor.
5.5.5 The problem of water vapour continuum
As seen on 5.4 the IR window (8-14 pm) is of major importance in the LW radiation transfer since it corresponds to the maximum of the Planck function for terrestrial temperatures.
Unfortunately, the spectral absorption in that domain is not very well known. In addition to