

Over the past decade, recent increases in the availability of PMW data (SSM/I,
TMI, AMSU, AMSR) have led to the emergence of several near-global, highresolution products which have been showing utility for near-real time use.
2005
5°S−5°N GPCP (mm / mon)
2000
1995
1990
1985
1980
120E
−80
−60
−40
−20
20
40
60
80
140E
180
160E
140W
160W
100W
120W
80W
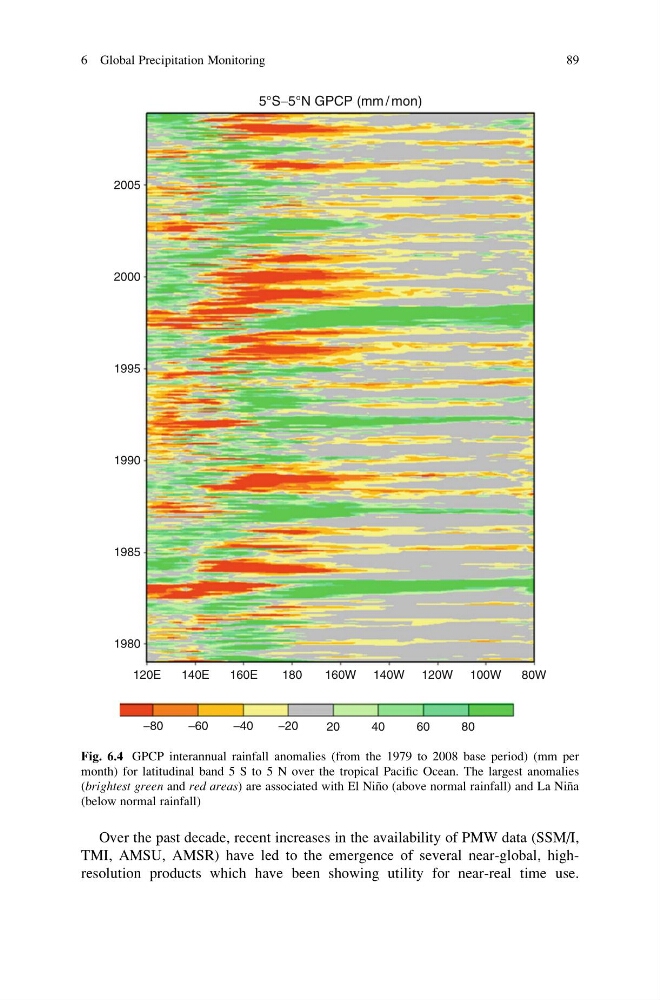
Fig. 6.4 GPCP interannual rainfall anomalies (from the 1979 to 2008 base period) (mm per
month) for latitudinal band 5 S to 5 N over the tropical Pacific Ocean. The largest anomalies
(brightest green and red areas) are associated with El Nin ˜o (above normal rainfall) and La Nin ˜a
(below normal rainfall)
6 Global Precipitation Monitoring
89
TMI, AMSU, AMSR) have led to the emergence of several near-global, highresolution products which have been showing utility for near-real time use.
2005
5°S−5°N GPCP (mm / mon)
2000
1995
1990
1985
1980
120E
−80
−60
−40
−20
20
40
60
80
140E
180
160E
140W
160W
100W
120W
80W
Fig. 6.4 GPCP interannual rainfall anomalies (from the 1979 to 2008 base period) (mm per
month) for latitudinal band 5 S to 5 N over the tropical Pacific Ocean. The largest anomalies
(brightest green and red areas) are associated with El Nin ˜o (above normal rainfall) and La Nin ˜a
(below normal rainfall)
6 Global Precipitation Monitoring
89