

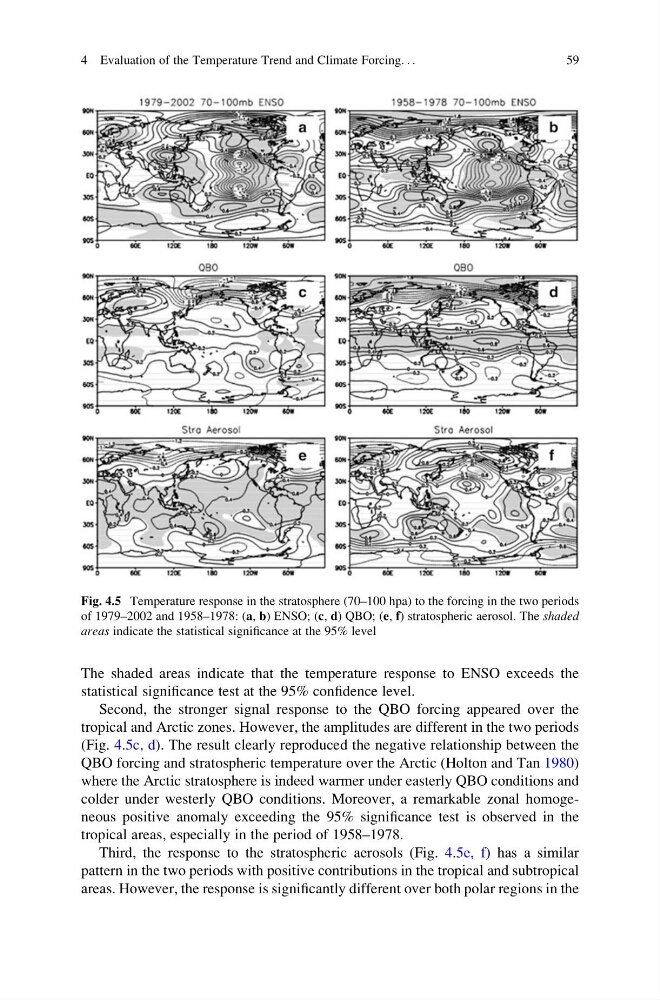
The shaded areas indicate that the temperature response to ENSO exceeds the
statistical significance test at the 95% confidence level.
Second, the stronger signal response to the QBO forcing appeared over the
tropical and Arctic zones. However, the amplitudes are different in the two periods
(Fig. 4.5c, d). The result clearly reproduced the negative relationship between the
QBO forcing and stratospheric temperature over the Arctic (Holton and Tan 1980)
where the Arctic stratosphere is indeed warmer under easterly QBO conditions and
colder under westerly QBO conditions. Moreover, a remarkable zonal homogeneous positive anomaly exceeding the 95% significance test is observed in the
tropical areas, especially in the period of 1958–1978.
Third, the response to the stratospheric aerosols (Fig. 4.5e, f) has a similar
pattern in the two periods with positive contributions in the tropical and subtropical
areas. However, the response is significantly different over both polar regions in the
Fig. 4.5 Temperature response in the stratosphere (70–100 hpa) to the forcing in the two periods
of 1979–2002 and 1958–1978: (a, b) ENSO; (c, d) QBO; (e, f) stratospheric aerosol. The shaded
areas indicate the statistical significance at the 95% level
4 Evaluation of the Temperature Trend and Climate Forcing. . .
59
statistical significance test at the 95% confidence level.
Second, the stronger signal response to the QBO forcing appeared over the
tropical and Arctic zones. However, the amplitudes are different in the two periods
(Fig. 4.5c, d). The result clearly reproduced the negative relationship between the
QBO forcing and stratospheric temperature over the Arctic (Holton and Tan 1980)
where the Arctic stratosphere is indeed warmer under easterly QBO conditions and
colder under westerly QBO conditions. Moreover, a remarkable zonal homogeneous positive anomaly exceeding the 95% significance test is observed in the
tropical areas, especially in the period of 1958–1978.
Third, the response to the stratospheric aerosols (Fig. 4.5e, f) has a similar
pattern in the two periods with positive contributions in the tropical and subtropical
areas. However, the response is significantly different over both polar regions in the
Fig. 4.5 Temperature response in the stratosphere (70–100 hpa) to the forcing in the two periods
of 1979–2002 and 1958–1978: (a, b) ENSO; (c, d) QBO; (e, f) stratospheric aerosol. The shaded
areas indicate the statistical significance at the 95% level
4 Evaluation of the Temperature Trend and Climate Forcing. . .
59