

VIIRS is a derivative of the MODIS instruments on the Aqua and Terra missions
with a large fraction of the capabilities found on MODIS along with some
improvements in spatial resolution. A comparison of the MODIS and VIIRS is
provided in Fig. 3.11 and Table 3.2 below.
The swath width of the VIIRS is 3,000 km, thereby providing total global daily
coverage.
3.5 Summary and Concluding Remarks
In previous sections, it has been described that from launch to early 2012, the Aqua
and MODIS instruments have been carefully calibrated and characterized, and
adjustments made for instrument change over time. This has led to Level 1 and
higher-level products that have been and can continue to be used reliably for
research and applications including changes driven by climate change albeit the
period of record is just a little over a decade.
As noted at the beginning of this chapter, MODIS observations extend and
improve on observations provided by the AVHRR that begin in 1978. As of early
2012, that means some products (e.g., cloud cover, snow cover, normalized difference vegetation index (NDVI), sea surface temperature) derivable from both
AVHRR and MODIS span over 30 years. Similarly Ocean Color products derived
from the SeaWiFS starting in 1997, and now being extended by Aqua MODIS,
cover nearly 15 years and perhaps a longer record depending on the utility of the
Optical_Depth_Land_And_Ocean_Mean_Std
MODIS/Aqua
MYDOB_M3.A2003001.051.2008335065851.hdf
01Jan2003
≥0.40000
0.300000
0.200000
0.100000
0.00000
nane
Optical_Depth_Land_And_Ocean_Mean_Mean
MODIS/Aqua
MYDOB_M3.A2009001.051.2009033111002.hdf
01Jan2009
≥0.80000
0.600000
0.400000
0.200000
0.00000
nane
Optical_Depth_Land_And_Ocean_Mean_Mean
MODIS/Aqua
MYDOB_M3.A2012001.051.2012032203819.hdf
01Jan2012
≥0.80000
0.600000
0.400000
0.200000
0.00000
nane
Optical_Depth_Land_And_Ocean_Mean_Mean
MODIS/Aqua
MYDOB_M3.A2006001.051.2009052235552.hdf
01Jan2006
≥0.80000
0.600000
0.400000
0.200000
0.00000
nane
a
b
c
d
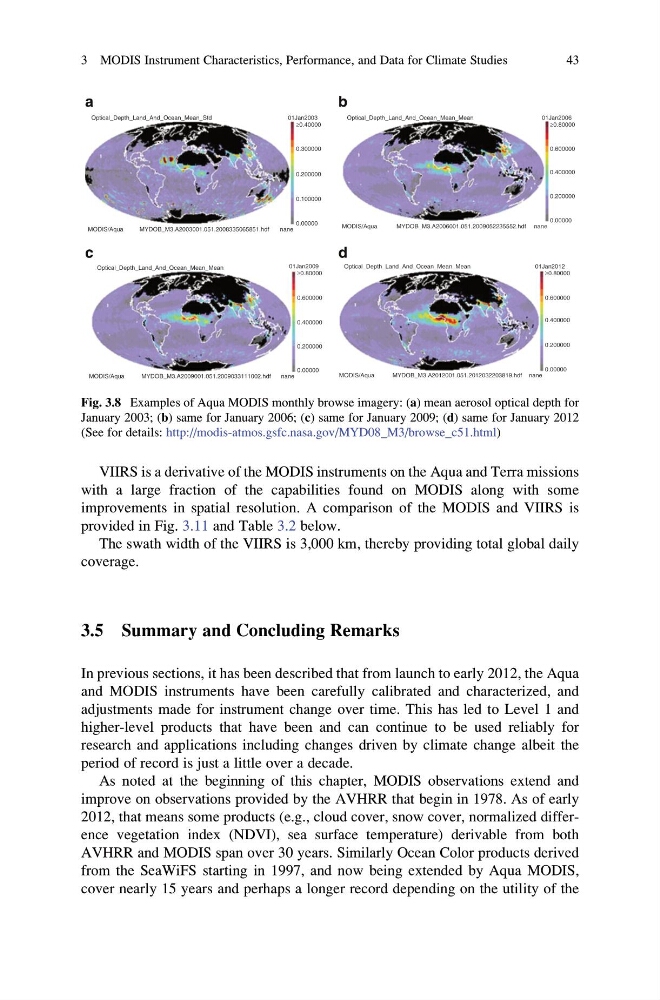
Fig. 3.8 Examples of Aqua MODIS monthly browse imagery: (a) mean aerosol optical depth for
January 2003; (b) same for January 2006; (c) same for January 2009; (d) same for January 2012
(See for details: http://modis-atmos.gsfc.nasa.gov/MYD08_M3/browse_c51.html)
3 MODIS Instrument Characteristics, Performance, and Data for Climate Studies
43
with a large fraction of the capabilities found on MODIS along with some
improvements in spatial resolution. A comparison of the MODIS and VIIRS is
provided in Fig. 3.11 and Table 3.2 below.
The swath width of the VIIRS is 3,000 km, thereby providing total global daily
coverage.
3.5 Summary and Concluding Remarks
In previous sections, it has been described that from launch to early 2012, the Aqua
and MODIS instruments have been carefully calibrated and characterized, and
adjustments made for instrument change over time. This has led to Level 1 and
higher-level products that have been and can continue to be used reliably for
research and applications including changes driven by climate change albeit the
period of record is just a little over a decade.
As noted at the beginning of this chapter, MODIS observations extend and
improve on observations provided by the AVHRR that begin in 1978. As of early
2012, that means some products (e.g., cloud cover, snow cover, normalized difference vegetation index (NDVI), sea surface temperature) derivable from both
AVHRR and MODIS span over 30 years. Similarly Ocean Color products derived
from the SeaWiFS starting in 1997, and now being extended by Aqua MODIS,
cover nearly 15 years and perhaps a longer record depending on the utility of the
Optical_Depth_Land_And_Ocean_Mean_Std
MODIS/Aqua
MYDOB_M3.A2003001.051.2008335065851.hdf
01Jan2003
≥0.40000
0.300000
0.200000
0.100000
0.00000
nane
Optical_Depth_Land_And_Ocean_Mean_Mean
MODIS/Aqua
MYDOB_M3.A2009001.051.2009033111002.hdf
01Jan2009
≥0.80000
0.600000
0.400000
0.200000
0.00000
nane
Optical_Depth_Land_And_Ocean_Mean_Mean
MODIS/Aqua
MYDOB_M3.A2012001.051.2012032203819.hdf
01Jan2012
≥0.80000
0.600000
0.400000
0.200000
0.00000
nane
Optical_Depth_Land_And_Ocean_Mean_Mean
MODIS/Aqua
MYDOB_M3.A2006001.051.2009052235552.hdf
01Jan2006
≥0.80000
0.600000
0.400000
0.200000
0.00000
nane
a
b
c
d
Fig. 3.8 Examples of Aqua MODIS monthly browse imagery: (a) mean aerosol optical depth for
January 2003; (b) same for January 2006; (c) same for January 2009; (d) same for January 2012
(See for details: http://modis-atmos.gsfc.nasa.gov/MYD08_M3/browse_c51.html)
3 MODIS Instrument Characteristics, Performance, and Data for Climate Studies
43