

potential (i.e., full turgor), which offsets the cellular osmotic potential so that Ψ is
0 MPa (Nobel 2009). Leaf wilting is a visible sign of water stress, which occurs
when the turgor pressure is 0 MPa and Ψ is equal to the osmotic potential. RWC and
Ψ for leaves are approximately the RWC and Ψ of the leaf mesophyll cells and are
unrelated to leaf area (A lf ), fresh weight (W f ), or dry weight (W d ). For a given leaf,
there is a one-to-one relationship between RWC and Ψ known as a “pressurevolume curve,” which is determined by measurement (Lenz et al. 2006; Nobel
2009).
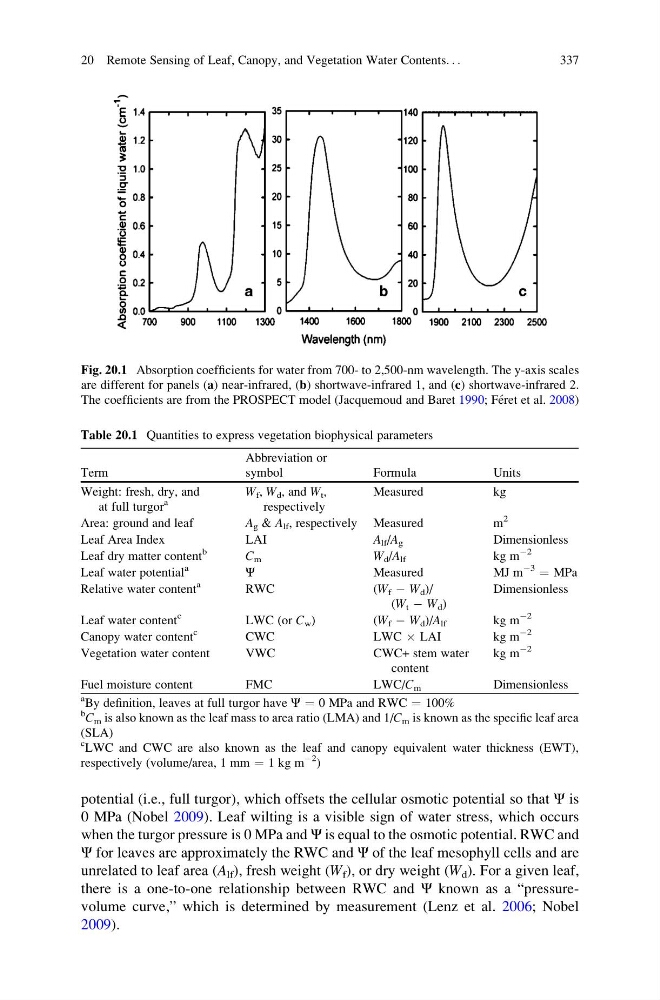
Fig. 20.1 Absorption coefficients for water from 700- to 2,500-nm wavelength. The y-axis scales
are different for panels (a) near-infrared, (b) shortwave-infrared 1, and (c) shortwave-infrared 2.
The coefficients are from the PROSPECT model (Jacquemoud and Baret 1990; Fe ´ret et al. 2008)
Table 20.1 Quantities to express vegetation biophysical parameters
Term
Abbreviation or
symbol
Formula
Units
Weight: fresh, dry, and
at full turgor
a
W f , W d , and W t ,
respectively
Measured
kg
Area: ground and leaf
A g & A lf , respectively Measured
m
2
Leaf Area Index
LAI
A lf /A g
Dimensionless
Leaf dry matter content
b
C m
W d /A lf
kg m
À2
Leaf water potential
a
Ψ
Measured
MJ m
À3 ¼ MPa
Relative water content
a
RWC
(W f À W d )/
(W t À W d )
Dimensionless
Leaf water content
c
LWC (or C w )
( W f À W d )/A lf
kg m
À2
Canopy water content
c
CWC
LWC Â LAI
kg m
À2
Vegetation water content
VWC
CWC+ stem water
content
kg m
À2
Fuel moisture content
FMC
LWC/C m
Dimensionless
a
By definition, leaves at full turgor have Ψ ¼ 0 MPa and RWC ¼ 100%
b
C m is also known as the leaf mass to area ratio (LMA) and 1/C m is known as the specific leaf area
(SLA)
c
LWC and CWC are also known as the leaf and canopy equivalent water thickness (EWT),
respectively (volume/area, 1 mm ¼ 1 kg m
À2
)
20 Remote Sensing of Leaf, Canopy, and Vegetation Water Contents. . .
337
0 MPa (Nobel 2009). Leaf wilting is a visible sign of water stress, which occurs
when the turgor pressure is 0 MPa and Ψ is equal to the osmotic potential. RWC and
Ψ for leaves are approximately the RWC and Ψ of the leaf mesophyll cells and are
unrelated to leaf area (A lf ), fresh weight (W f ), or dry weight (W d ). For a given leaf,
there is a one-to-one relationship between RWC and Ψ known as a “pressurevolume curve,” which is determined by measurement (Lenz et al. 2006; Nobel
2009).
Fig. 20.1 Absorption coefficients for water from 700- to 2,500-nm wavelength. The y-axis scales
are different for panels (a) near-infrared, (b) shortwave-infrared 1, and (c) shortwave-infrared 2.
The coefficients are from the PROSPECT model (Jacquemoud and Baret 1990; Fe ´ret et al. 2008)
Table 20.1 Quantities to express vegetation biophysical parameters
Term
Abbreviation or
symbol
Formula
Units
Weight: fresh, dry, and
at full turgor
a
W f , W d , and W t ,
respectively
Measured
kg
Area: ground and leaf
A g & A lf , respectively Measured
m
2
Leaf Area Index
LAI
A lf /A g
Dimensionless
Leaf dry matter content
b
C m
W d /A lf
kg m
À2
Leaf water potential
a
Ψ
Measured
MJ m
À3 ¼ MPa
Relative water content
a
RWC
(W f À W d )/
(W t À W d )
Dimensionless
Leaf water content
c
LWC (or C w )
( W f À W d )/A lf
kg m
À2
Canopy water content
c
CWC
LWC Â LAI
kg m
À2
Vegetation water content
VWC
CWC+ stem water
content
kg m
À2
Fuel moisture content
FMC
LWC/C m
Dimensionless
a
By definition, leaves at full turgor have Ψ ¼ 0 MPa and RWC ¼ 100%
b
C m is also known as the leaf mass to area ratio (LMA) and 1/C m is known as the specific leaf area
(SLA)
c
LWC and CWC are also known as the leaf and canopy equivalent water thickness (EWT),
respectively (volume/area, 1 mm ¼ 1 kg m
À2
)
20 Remote Sensing of Leaf, Canopy, and Vegetation Water Contents. . .
337