

18.3.2 Relationship to Environmental Variables and
Climatic Indices
Sea-surface temperatures during bloom events were highly variable between the
regions. The Bering Sea had the coolest temperatures, generally less than 10
C,
without any correspondence to the fraction of area covered by E. huxleyi blooms.
The Patagonian Shelf was the warmest, ranging from 10 to18
C. The regions south
of Iceland and in the Norwegian Seas ranged from 5
C to 12 and 16
C, respectively.
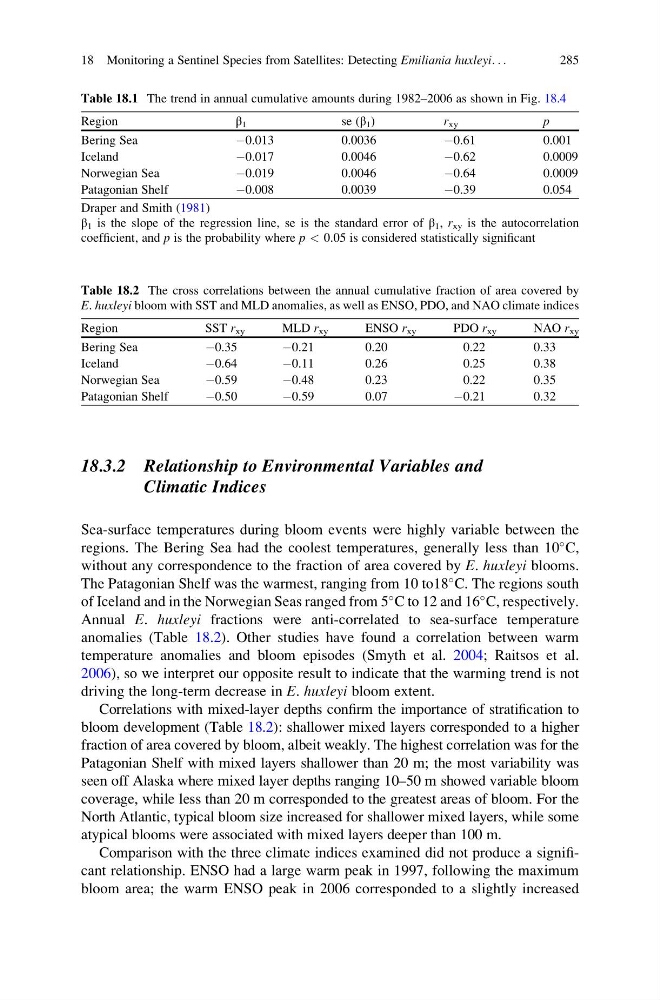
Annual E. huxleyi fractions were anti-correlated to sea-surface temperature
anomalies (Table 18.2). Other studies have found a correlation between warm
temperature anomalies and bloom episodes (Smyth et al. 2004; Raitsos et al.
2006), so we interpret our opposite result to indicate that the warming trend is not
driving the long-term decrease in E. huxleyi bloom extent.
Correlations with mixed-layer depths confirm the importance of stratification to
bloom development (Table 18.2): shallower mixed layers corresponded to a higher
fraction of area covered by bloom, albeit weakly. The highest correlation was for the
Patagonian Shelf with mixed layers shallower than 20 m; the most variability was
seen off Alaska where mixed layer depths ranging 10–50 m showed variable bloom
coverage, while less than 20 m corresponded to the greatest areas of bloom. For the
North Atlantic, typical bloom size increased for shallower mixed layers, while some
atypical blooms were associated with mixed layers deeper than 100 m.
Comparison with the three climate indices examined did not produce a significant relationship. ENSO had a large warm peak in 1997, following the maximum
bloom area; the warm ENSO peak in 2006 corresponded to a slightly increased
Table 18.1 The trend in annual cumulative amounts during 1982–2006 as shown in Fig. 18.4
Region
β 1
se (β 1 )
r xy
p
Bering Sea
À0.013
0.0036
À0.61
0.001
Iceland
À0.017
0.0046
À0.62
0.0009
Norwegian Sea
À0.019
0.0046
À0.64
0.0009
Patagonian Shelf
À0.008
0.0039
À0.39
0.054
Draper and Smith (1981)
β 1 is the slope of the regression line, se is the standard error of β 1 , r xy is the autocorrelation
coefficient, and p is the probability where p < 0.05 is considered statistically significant
Table 18.2 The cross correlations between the annual cumulative fraction of area covered by
E. huxleyi bloom with SST and MLD anomalies, as well as ENSO, PDO, and NAO climate indices
Region
SST r xy
MLD r xy
ENSO r xy
PDO r xy
NAO r xy
Bering Sea
À0.35
À0.21
0.20
0.22
0.33
Iceland
À0.64
À0.11
0.26
0.25
0.38
Norwegian Sea
À0.59
À0.48
0.23
0.22
0.35
Patagonian Shelf
À0.50
À0.59
0.07
À0.21
0.32
18 Monitoring a Sentinel Species from Satellites: Detecting Emiliania huxleyi. . .
285
Climatic Indices
Sea-surface temperatures during bloom events were highly variable between the
regions. The Bering Sea had the coolest temperatures, generally less than 10
C,
without any correspondence to the fraction of area covered by E. huxleyi blooms.
The Patagonian Shelf was the warmest, ranging from 10 to18
C. The regions south
of Iceland and in the Norwegian Seas ranged from 5
C to 12 and 16
C, respectively.
Annual E. huxleyi fractions were anti-correlated to sea-surface temperature
anomalies (Table 18.2). Other studies have found a correlation between warm
temperature anomalies and bloom episodes (Smyth et al. 2004; Raitsos et al.
2006), so we interpret our opposite result to indicate that the warming trend is not
driving the long-term decrease in E. huxleyi bloom extent.
Correlations with mixed-layer depths confirm the importance of stratification to
bloom development (Table 18.2): shallower mixed layers corresponded to a higher
fraction of area covered by bloom, albeit weakly. The highest correlation was for the
Patagonian Shelf with mixed layers shallower than 20 m; the most variability was
seen off Alaska where mixed layer depths ranging 10–50 m showed variable bloom
coverage, while less than 20 m corresponded to the greatest areas of bloom. For the
North Atlantic, typical bloom size increased for shallower mixed layers, while some
atypical blooms were associated with mixed layers deeper than 100 m.
Comparison with the three climate indices examined did not produce a significant relationship. ENSO had a large warm peak in 1997, following the maximum
bloom area; the warm ENSO peak in 2006 corresponded to a slightly increased
Table 18.1 The trend in annual cumulative amounts during 1982–2006 as shown in Fig. 18.4
Region
β 1
se (β 1 )
r xy
p
Bering Sea
À0.013
0.0036
À0.61
0.001
Iceland
À0.017
0.0046
À0.62
0.0009
Norwegian Sea
À0.019
0.0046
À0.64
0.0009
Patagonian Shelf
À0.008
0.0039
À0.39
0.054
Draper and Smith (1981)
β 1 is the slope of the regression line, se is the standard error of β 1 , r xy is the autocorrelation
coefficient, and p is the probability where p < 0.05 is considered statistically significant
Table 18.2 The cross correlations between the annual cumulative fraction of area covered by
E. huxleyi bloom with SST and MLD anomalies, as well as ENSO, PDO, and NAO climate indices
Region
SST r xy
MLD r xy
ENSO r xy
PDO r xy
NAO r xy
Bering Sea
À0.35
À0.21
0.20
0.22
0.33
Iceland
À0.64
À0.11
0.26
0.25
0.38
Norwegian Sea
À0.59
À0.48
0.23
0.22
0.35
Patagonian Shelf
À0.50
À0.59
0.07
À0.21
0.32
18 Monitoring a Sentinel Species from Satellites: Detecting Emiliania huxleyi. . .
285