

over the 25-year period. The seasonal cycle in the coverage of E. huxleyi was
calculated by averaging coincident periods for all years and performing a 5-week
running box car filter. Anomalies were not found useful for this analysis due to the
annual variability in bloom onset; therefore, this analysis focused on the original time
series and annual cumulative values.
18.2.4 Geophysical Data and Climate Indices
The areal extent of E. huxleyi blooms were compared to sea-surface temperature
(SST) and mixed-layer depth. Optimally interpolated weekly and monthly
1
resolution SST (NOAA OI.v2) were created from in situ and satellite-derived
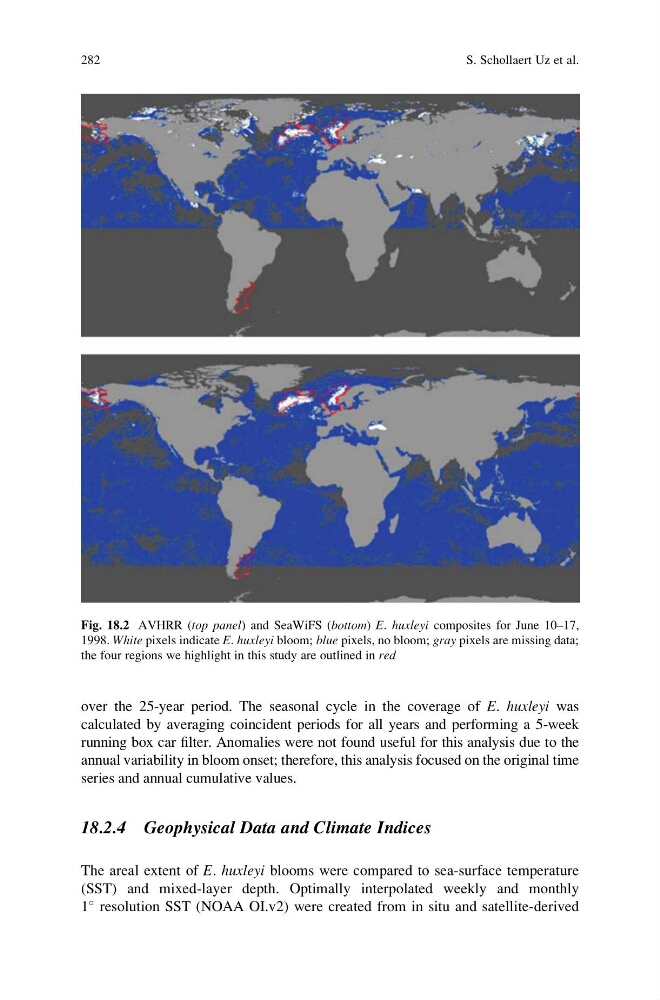
Fig. 18.2 AVHRR (top panel) and SeaWiFS (bottom) E. huxleyi composites for June 10–17,
1998. White pixels indicate E. huxleyi bloom; blue pixels, no bloom; gray pixels are missing data;
the four regions we highlight in this study are outlined in red
282
S. Schollaert Uz et al.
calculated by averaging coincident periods for all years and performing a 5-week
running box car filter. Anomalies were not found useful for this analysis due to the
annual variability in bloom onset; therefore, this analysis focused on the original time
series and annual cumulative values.
18.2.4 Geophysical Data and Climate Indices
The areal extent of E. huxleyi blooms were compared to sea-surface temperature
(SST) and mixed-layer depth. Optimally interpolated weekly and monthly
1
resolution SST (NOAA OI.v2) were created from in situ and satellite-derived
Fig. 18.2 AVHRR (top panel) and SeaWiFS (bottom) E. huxleyi composites for June 10–17,
1998. White pixels indicate E. huxleyi bloom; blue pixels, no bloom; gray pixels are missing data;
the four regions we highlight in this study are outlined in red
282
S. Schollaert Uz et al.