

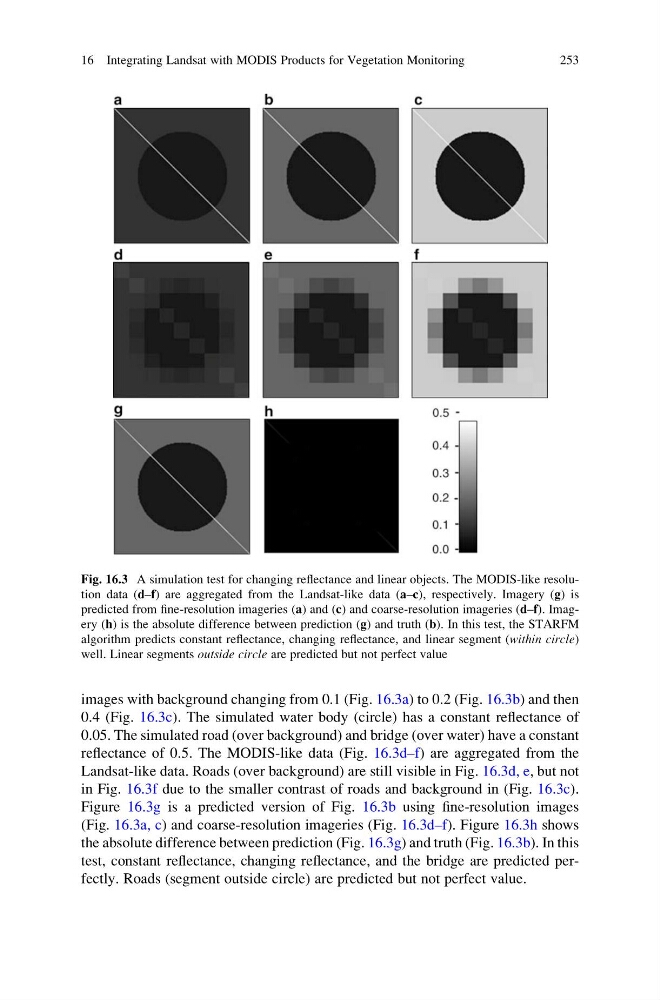
images with background changing from 0.1 (Fig. 16.3a) to 0.2 (Fig. 16.3b) and then
0.4 (Fig. 16.3c). The simulated water body (circle) has a constant reflectance of
0.05. The simulated road (over background) and bridge (over water) have a constant
reflectance of 0.5. The MODIS-like data (Fig. 16.3d–f) are aggregated from the
Landsat-like data. Roads (over background) are still visible in Fig. 16.3d, e, but not
in Fig. 16.3f due to the smaller contrast of roads and background in (Fig. 16.3c).
Figure 16.3g is a predicted version of Fig. 16.3b using fine-resolution images
(Fig. 16.3a, c) and coarse-resolution imageries (Fig. 16.3d–f). Figure 16.3h shows
the absolute difference between prediction (Fig. 16.3g) and truth (Fig. 16.3b). In this
test, constant reflectance, changing reflectance, and the bridge are predicted perfectly. Roads (segment outside circle) are predicted but not perfect value.
Fig. 16.3 A simulation test for changing reflectance and linear objects. The MODIS-like resolution data (d–f) are aggregated from the Landsat-like data (a–c), respectively. Imagery (g) is
predicted from fine-resolution imageries (a) and (c) and coarse-resolution imageries (d–f). Imagery (h) is the absolute difference between prediction (g) and truth (b). In this test, the STARFM
algorithm predicts constant reflectance, changing reflectance, and linear segment (within circle)
well. Linear segments outside circle are predicted but not perfect value
16 Integrating Landsat with MODIS Products for Vegetation Monitoring
253
0.4 (Fig. 16.3c). The simulated water body (circle) has a constant reflectance of
0.05. The simulated road (over background) and bridge (over water) have a constant
reflectance of 0.5. The MODIS-like data (Fig. 16.3d–f) are aggregated from the
Landsat-like data. Roads (over background) are still visible in Fig. 16.3d, e, but not
in Fig. 16.3f due to the smaller contrast of roads and background in (Fig. 16.3c).
Figure 16.3g is a predicted version of Fig. 16.3b using fine-resolution images
(Fig. 16.3a, c) and coarse-resolution imageries (Fig. 16.3d–f). Figure 16.3h shows
the absolute difference between prediction (Fig. 16.3g) and truth (Fig. 16.3b). In this
test, constant reflectance, changing reflectance, and the bridge are predicted perfectly. Roads (segment outside circle) are predicted but not perfect value.
Fig. 16.3 A simulation test for changing reflectance and linear objects. The MODIS-like resolution data (d–f) are aggregated from the Landsat-like data (a–c), respectively. Imagery (g) is
predicted from fine-resolution imageries (a) and (c) and coarse-resolution imageries (d–f). Imagery (h) is the absolute difference between prediction (g) and truth (b). In this test, the STARFM
algorithm predicts constant reflectance, changing reflectance, and linear segment (within circle)
well. Linear segments outside circle are predicted but not perfect value
16 Integrating Landsat with MODIS Products for Vegetation Monitoring
253