

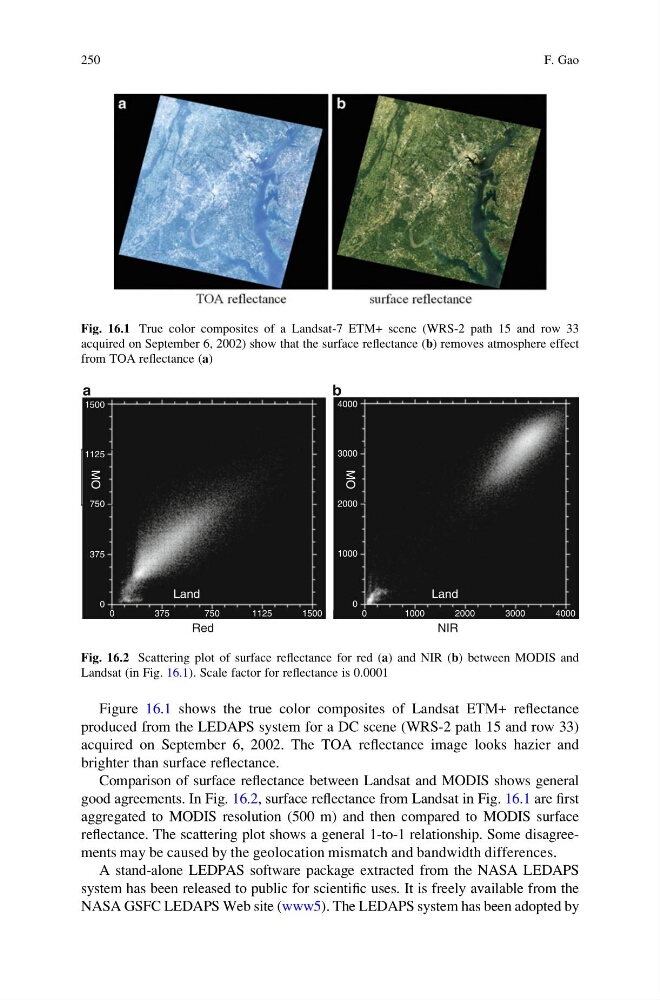
Figure 16.1 shows the true color composites of Landsat ETM+ reflectance
produced from the LEDAPS system for a DC scene (WRS-2 path 15 and row 33)
acquired on September 6, 2002. The TOA reflectance image looks hazier and
brighter than surface reflectance.
Comparison of surface reflectance between Landsat and MODIS shows general
good agreements. In Fig. 16.2, surface reflectance from Landsat in Fig. 16.1 are first
aggregated to MODIS resolution (500 m) and then compared to MODIS surface
reflectance. The scattering plot shows a general 1-to-1 relationship. Some disagreements may be caused by the geolocation mismatch and bandwidth differences.
A stand-alone LEDPAS software package extracted from the NASA LEDAPS
system has been released to public for scientific uses. It is freely available from the
NASA GSFC LEDAPS Web site (www5). The LEDAPS system has been adopted by
Fig. 16.1 True color composites of a Landsat-7 ETM+ scene (WRS-2 path 15 and row 33
acquired on September 6, 2002) show that the surface reflectance (b) removes atmosphere effect
from TOA reflectance (a)
1125
750
375
Land
Red
a
b
NIR
Land
4000
3000
2000
1000
0
0
1000
2000
3000
4000
0
375
750
1125
1500
0
1500
MO
MO
Fig. 16.2 Scattering plot of surface reflectance for red (a) and NIR (b) between MODIS and
Landsat (in Fig. 16.1). Scale factor for reflectance is 0.0001
250
F. Gao
produced from the LEDAPS system for a DC scene (WRS-2 path 15 and row 33)
acquired on September 6, 2002. The TOA reflectance image looks hazier and
brighter than surface reflectance.
Comparison of surface reflectance between Landsat and MODIS shows general
good agreements. In Fig. 16.2, surface reflectance from Landsat in Fig. 16.1 are first
aggregated to MODIS resolution (500 m) and then compared to MODIS surface
reflectance. The scattering plot shows a general 1-to-1 relationship. Some disagreements may be caused by the geolocation mismatch and bandwidth differences.
A stand-alone LEDPAS software package extracted from the NASA LEDAPS
system has been released to public for scientific uses. It is freely available from the
NASA GSFC LEDAPS Web site (www5). The LEDAPS system has been adopted by
Fig. 16.1 True color composites of a Landsat-7 ETM+ scene (WRS-2 path 15 and row 33
acquired on September 6, 2002) show that the surface reflectance (b) removes atmosphere effect
from TOA reflectance (a)
1125
750
375
Land
Red
a
b
NIR
Land
4000
3000
2000
1000
0
0
1000
2000
3000
4000
0
375
750
1125
1500
0
1500
MO
MO
Fig. 16.2 Scattering plot of surface reflectance for red (a) and NIR (b) between MODIS and
Landsat (in Fig. 16.1). Scale factor for reflectance is 0.0001
250
F. Gao