

to be zero. The water balance was formulated as an estimate of the irrigation
supplied by groundwater resources:
GW abstract ¼ ET act À P effect À SW irrig
(13.10)
where GW abstract is the groundwater resources abstracted for irrigation and consumed by crops; ET act is the actual evapotranspiration—the total crop
consumption—taken from the METRIC-derived actual ET maps; P effect is the
effective precipitation that contributes to satisfying crop demands and computed
from gridded precipitation estimates based on weather station data analysis
described in Sect. 4 and validated with satellite-based grid data; and SW irrig is the
surface water irrigation deliveries per ORMVA records for each irrigated perimeter
(average size approximately 100 ha), with volumes converted to irrigation depth
based on adjusted irrigated sector areas calculated using GIS tools. In addition, a
groundwater indicator was derived for monitoring and assessing irrigation
performance:
GW Indicator ð%Þ ¼ ðGW abstract =ET act Þ Â 100
(13.11)
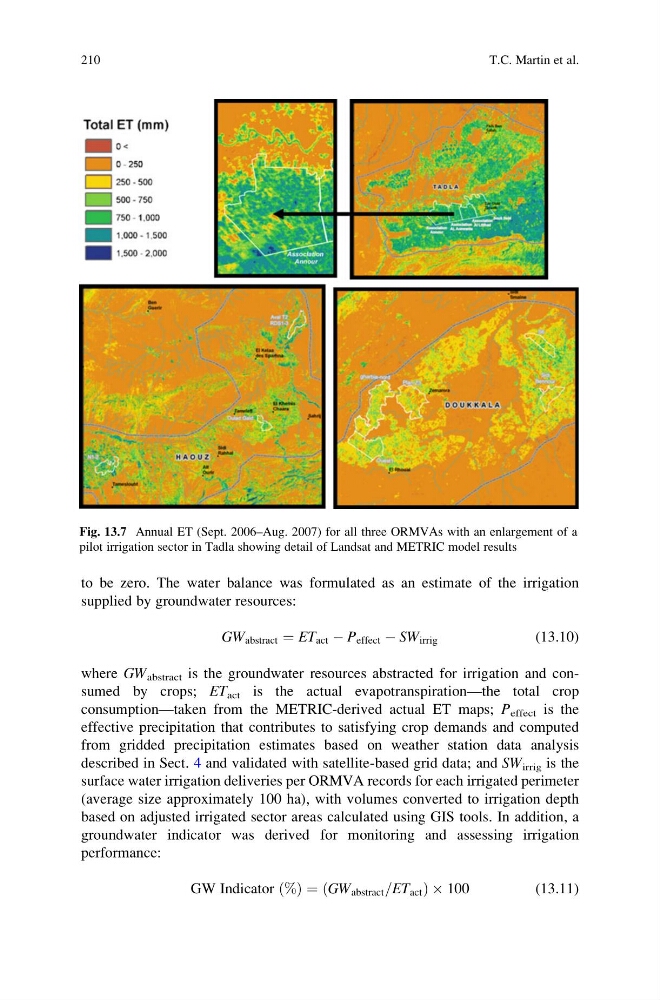
Fig. 13.7 Annual ET (Sept. 2006–Aug. 2007) for all three ORMVAs with an enlargement of a
pilot irrigation sector in Tadla showing detail of Landsat and METRIC model results
210
T.C. Martin et al.
supplied by groundwater resources:
GW abstract ¼ ET act À P effect À SW irrig
(13.10)
where GW abstract is the groundwater resources abstracted for irrigation and consumed by crops; ET act is the actual evapotranspiration—the total crop
consumption—taken from the METRIC-derived actual ET maps; P effect is the
effective precipitation that contributes to satisfying crop demands and computed
from gridded precipitation estimates based on weather station data analysis
described in Sect. 4 and validated with satellite-based grid data; and SW irrig is the
surface water irrigation deliveries per ORMVA records for each irrigated perimeter
(average size approximately 100 ha), with volumes converted to irrigation depth
based on adjusted irrigated sector areas calculated using GIS tools. In addition, a
groundwater indicator was derived for monitoring and assessing irrigation
performance:
GW Indicator ð%Þ ¼ ðGW abstract =ET act Þ Â 100
(13.11)
Fig. 13.7 Annual ET (Sept. 2006–Aug. 2007) for all three ORMVAs with an enlargement of a
pilot irrigation sector in Tadla showing detail of Landsat and METRIC model results
210
T.C. Martin et al.