

28
DJF , 60°N
a
b
c
d
e
(S:0.0192 ±0.0756,P:0.198; S:0.0171 ±0.0159,P:0.703: S:0.0043 ±0.0035,P:0.766)
(S:−0.2611 ±0.0612,P:0.999; S:−0.0222 ±0.0262,P:0.591: S:−0.0039 ±0.0006,P:1.000)
(S:−0.0863 ±0.0185,P:1.000; S:0.0020 ±0.0181,P:0.087: S:−0.0031 ±0.0007,P:1.000)
(S:−0.1540 ±0.0531,P:0.990; S:0.0040 ±0.0106,P:0.286; S:0.0002±0.0014,P:0.105)
(S:−0.1217 ±0.0273,P:1.000; S:0.0004 ±0.0109,P:0.026; S:−0.0005±0.0008,P:0.502)
5.5
0.8
0.6
0.7
0.5
0.66
0.64
0.62
0.60
0.58
0.56
0.54
0.52
0.40
0.38
0.36
0.34
0.32
0.65
Cloud Optical Depth (Unitless)
Cloud Particle Phase (0=Liquid, 1Solid)
0.55
0.50
0.60
0.58
0.56
0.54
0.52
5.0
4.5
4.0
7.0
6.5
6.0
5.5
5.5
5.0
5.0
4.5
4.5
5.8
5.6
5.4
5.2
5.0
4.8
4.6
4.8
5.8
5.6
5.4
5.2
5.0
4.0
6.5
6.0
6.0
24
22
20
18
20
18
16
14
12
11.5
JJA
MAM
SON
ANNUAL
11.0
10.5
10.0
9.5
9.0
8.5
20
19
Cloud Particle Effective Radius (µm)
18
17
16
15
14
19
18
17
18
15
14
Cloud particle effective radius
82 83 84 85 86 87 88 89 90 91 92 93 94 95 96 97 98 99
Year
Cloud particle phase
Cloud optical depth
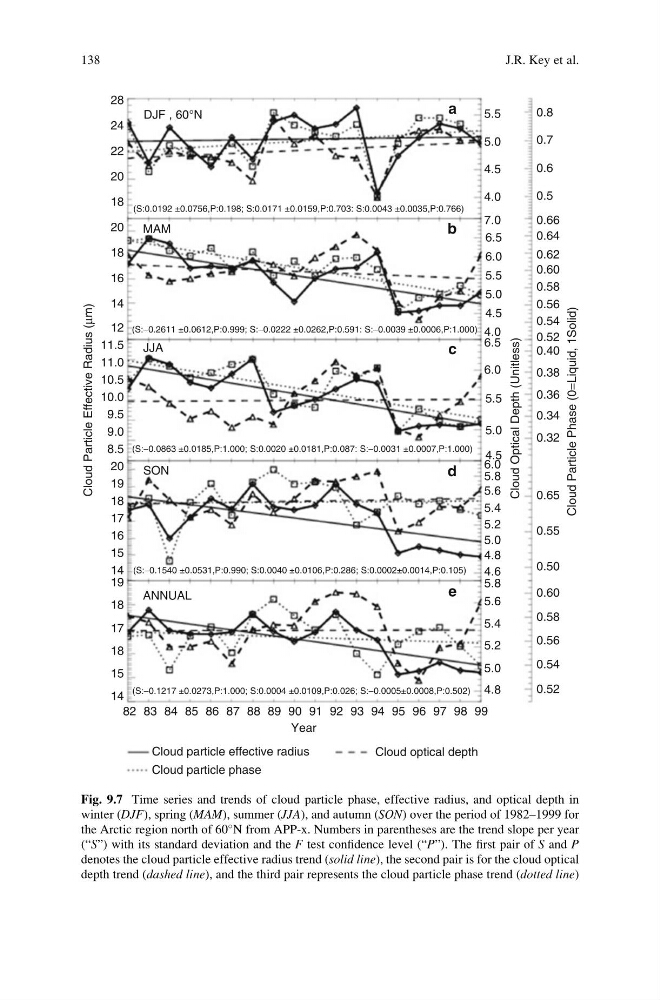
Fig. 9.7 Time series and trends of cloud particle phase, effective radius, and optical depth in
winter (DJF), spring (MAM), summer (JJA), and autumn (SON) over the period of 1982–1999 for
the Arctic region north of 60
N from APP-x. Numbers in parentheses are the trend slope per year
(“S”) with its standard deviation and the F test confidence level (“P”). The first pair of S and P
denotes the cloud particle effective radius trend (solid line), the second pair is for the cloud optical
depth trend (dashed line), and the third pair represents the cloud particle phase trend (dotted line)
138
J.R. Key et al.
DJF , 60°N
a
b
c
d
e
(S:0.0192 ±0.0756,P:0.198; S:0.0171 ±0.0159,P:0.703: S:0.0043 ±0.0035,P:0.766)
(S:−0.2611 ±0.0612,P:0.999; S:−0.0222 ±0.0262,P:0.591: S:−0.0039 ±0.0006,P:1.000)
(S:−0.0863 ±0.0185,P:1.000; S:0.0020 ±0.0181,P:0.087: S:−0.0031 ±0.0007,P:1.000)
(S:−0.1540 ±0.0531,P:0.990; S:0.0040 ±0.0106,P:0.286; S:0.0002±0.0014,P:0.105)
(S:−0.1217 ±0.0273,P:1.000; S:0.0004 ±0.0109,P:0.026; S:−0.0005±0.0008,P:0.502)
5.5
0.8
0.6
0.7
0.5
0.66
0.64
0.62
0.60
0.58
0.56
0.54
0.52
0.40
0.38
0.36
0.34
0.32
0.65
Cloud Optical Depth (Unitless)
Cloud Particle Phase (0=Liquid, 1Solid)
0.55
0.50
0.60
0.58
0.56
0.54
0.52
5.0
4.5
4.0
7.0
6.5
6.0
5.5
5.5
5.0
5.0
4.5
4.5
5.8
5.6
5.4
5.2
5.0
4.8
4.6
4.8
5.8
5.6
5.4
5.2
5.0
4.0
6.5
6.0
6.0
24
22
20
18
20
18
16
14
12
11.5
JJA
MAM
SON
ANNUAL
11.0
10.5
10.0
9.5
9.0
8.5
20
19
Cloud Particle Effective Radius (µm)
18
17
16
15
14
19
18
17
18
15
14
Cloud particle effective radius
82 83 84 85 86 87 88 89 90 91 92 93 94 95 96 97 98 99
Year
Cloud particle phase
Cloud optical depth
Fig. 9.7 Time series and trends of cloud particle phase, effective radius, and optical depth in
winter (DJF), spring (MAM), summer (JJA), and autumn (SON) over the period of 1982–1999 for
the Arctic region north of 60
N from APP-x. Numbers in parentheses are the trend slope per year
(“S”) with its standard deviation and the F test confidence level (“P”). The first pair of S and P
denotes the cloud particle effective radius trend (solid line), the second pair is for the cloud optical
depth trend (dashed line), and the third pair represents the cloud particle phase trend (dotted line)
138
J.R. Key et al.