

Cloud and water vapor tracking with MODIS data is based on the established
procedure used for the GOES, which is essentially that described in Merrill (1989),
Nieman et al. (1997), and Velden et al. (1997, 1998). Cloud features are tracked in
the infrared (IR) window band at 11 μm on MODIS and the Advanced Very High
Resolution Radiometer (AVHRR), and water vapor (WV) features are tracked in
the 6.7 μm band on MODIS. Even though AVHRR and MODIS have a visible
channel, it is not generally useful for winds in polar regions because of the long
winter darkness and low sun angles during the summer that make feature tracking
difficult. With monthly average cloud amounts over the Arctic and Antarctic
ranging from 50 to 90% and annual mean cloud coverage of about 70% over the
Arctic, potential cloud targets are numerous (Key et al. 2003).
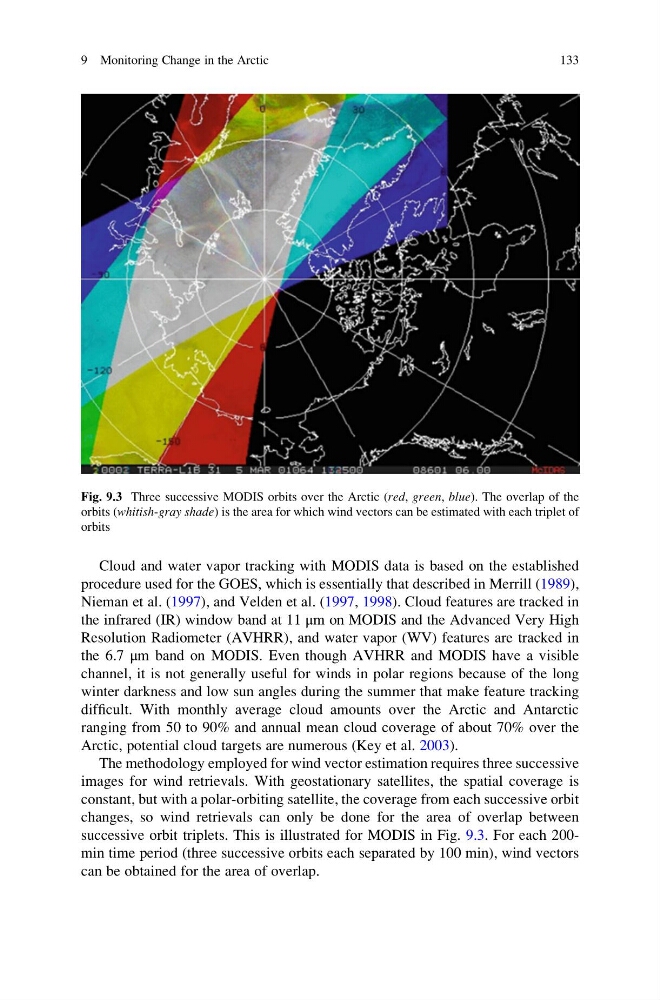
The methodology employed for wind vector estimation requires three successive
images for wind retrievals. With geostationary satellites, the spatial coverage is
constant, but with a polar-orbiting satellite, the coverage from each successive orbit
changes, so wind retrievals can only be done for the area of overlap between
successive orbit triplets. This is illustrated for MODIS in Fig. 9.3. For each 200min time period (three successive orbits each separated by 100 min), wind vectors
can be obtained for the area of overlap.
Fig. 9.3 Three successive MODIS orbits over the Arctic (red, green, blue). The overlap of the
orbits (whitish-gray shade) is the area for which wind vectors can be estimated with each triplet of
orbits
9 Monitoring Change in the Arctic
133
procedure used for the GOES, which is essentially that described in Merrill (1989),
Nieman et al. (1997), and Velden et al. (1997, 1998). Cloud features are tracked in
the infrared (IR) window band at 11 μm on MODIS and the Advanced Very High
Resolution Radiometer (AVHRR), and water vapor (WV) features are tracked in
the 6.7 μm band on MODIS. Even though AVHRR and MODIS have a visible
channel, it is not generally useful for winds in polar regions because of the long
winter darkness and low sun angles during the summer that make feature tracking
difficult. With monthly average cloud amounts over the Arctic and Antarctic
ranging from 50 to 90% and annual mean cloud coverage of about 70% over the
Arctic, potential cloud targets are numerous (Key et al. 2003).
The methodology employed for wind vector estimation requires three successive
images for wind retrievals. With geostationary satellites, the spatial coverage is
constant, but with a polar-orbiting satellite, the coverage from each successive orbit
changes, so wind retrievals can only be done for the area of overlap between
successive orbit triplets. This is illustrated for MODIS in Fig. 9.3. For each 200min time period (three successive orbits each separated by 100 min), wind vectors
can be obtained for the area of overlap.
Fig. 9.3 Three successive MODIS orbits over the Arctic (red, green, blue). The overlap of the
orbits (whitish-gray shade) is the area for which wind vectors can be estimated with each triplet of
orbits
9 Monitoring Change in the Arctic
133