

2.3 Theoretical Spectrum
Based on methodologies, we can divide previous climate change impact assessment
studies into three categories, viz., production function approach, Ricardian
approach and crop modelling. Although crop modelling approach arrives to the
most reliable estimates, however, it is costly and difficult to implement in developing countries (Kurukulasuriya and Ajwad 2007). Out of three, Ricardian
approach seems most suitable in case of Pakistan. However, due to feeble documentation of agricultural farmland values and imperfect land markets in Pakistan, it
would not be optimal to employ the Ricardian approach (Gbetibouo and Hassan
2005; Guiteras 2009). Moreover, Cline (1996) pointed out that constant price
assumption in Ricardian method will lead to biased estimates in the welfare calculations. Given the above-mentioned facts, we employed a widely used method,
i.e. production function approach, to assess the impact of climatic parameters on
wheat yield in Pakistan (Isik and Devadoss 2006; Poudel and Kotani 2013;
De Salvo et al. 2013).
2.4 Panel Data Model Specification
As already stated we employed panel data estimation model as it is the most reliable
model when there is a problem of omitted variables.
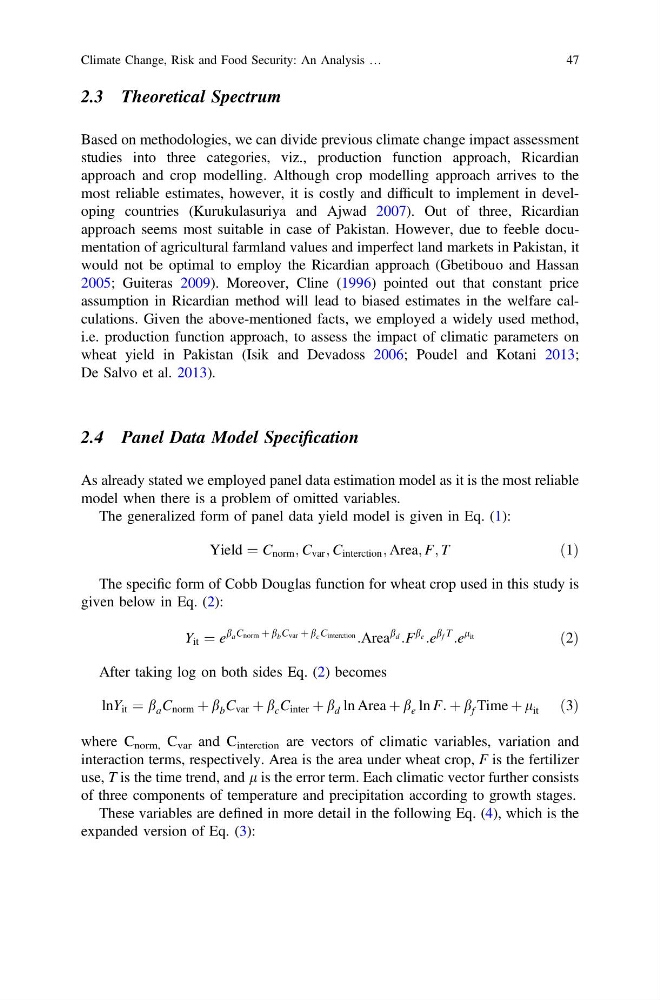
The generalized form of panel data yield model is given in Eq. (1):
Yield ¼ C norm ; C var ; C interction ; Area; F; T
ð1Þ
The specific form of Cobb Douglas function for wheat crop used in this study is
given below in Eq. (2):
Y it ¼ e
b a C norm þ b b C var þ b c C interction :Area
b d :F
b e :e
b f T
:e
l it
ð2Þ
After taking log on both sides Eq. (2) becomes
lnY it ¼ b a C norm þ b b C var þ b c C inter þ b d ln Area þ b e ln F: þ b f Time þ l it ð3Þ
where C norm, C var and C interction are vectors of climatic variables, variation and
interaction terms, respectively. Area is the area under wheat crop, F is the fertilizer
use, T is the time trend, and l is the error term. Each climatic vector further consists
of three components of temperature and precipitation according to growth stages.
These variables are defined in more detail in the following Eq. (4), which is the
expanded version of Eq. (3):
Climate Change, Risk and Food Security: An Analysis …
47
Based on methodologies, we can divide previous climate change impact assessment
studies into three categories, viz., production function approach, Ricardian
approach and crop modelling. Although crop modelling approach arrives to the
most reliable estimates, however, it is costly and difficult to implement in developing countries (Kurukulasuriya and Ajwad 2007). Out of three, Ricardian
approach seems most suitable in case of Pakistan. However, due to feeble documentation of agricultural farmland values and imperfect land markets in Pakistan, it
would not be optimal to employ the Ricardian approach (Gbetibouo and Hassan
2005; Guiteras 2009). Moreover, Cline (1996) pointed out that constant price
assumption in Ricardian method will lead to biased estimates in the welfare calculations. Given the above-mentioned facts, we employed a widely used method,
i.e. production function approach, to assess the impact of climatic parameters on
wheat yield in Pakistan (Isik and Devadoss 2006; Poudel and Kotani 2013;
De Salvo et al. 2013).
2.4 Panel Data Model Specification
As already stated we employed panel data estimation model as it is the most reliable
model when there is a problem of omitted variables.
The generalized form of panel data yield model is given in Eq. (1):
Yield ¼ C norm ; C var ; C interction ; Area; F; T
ð1Þ
The specific form of Cobb Douglas function for wheat crop used in this study is
given below in Eq. (2):
Y it ¼ e
b a C norm þ b b C var þ b c C interction :Area
b d :F
b e :e
b f T
:e
l it
ð2Þ
After taking log on both sides Eq. (2) becomes
lnY it ¼ b a C norm þ b b C var þ b c C inter þ b d ln Area þ b e ln F: þ b f Time þ l it ð3Þ
where C norm, C var and C interction are vectors of climatic variables, variation and
interaction terms, respectively. Area is the area under wheat crop, F is the fertilizer
use, T is the time trend, and l is the error term. Each climatic vector further consists
of three components of temperature and precipitation according to growth stages.
These variables are defined in more detail in the following Eq. (4), which is the
expanded version of Eq. (3):
Climate Change, Risk and Food Security: An Analysis …
47