

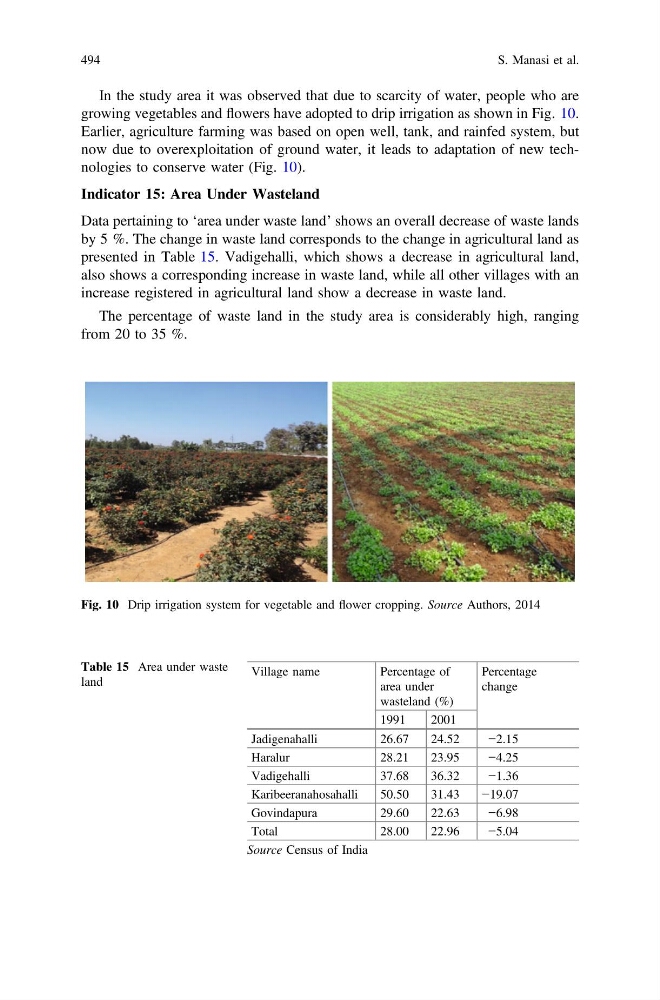
In the study area it was observed that due to scarcity of water, people who are
growing vegetables and flowers have adopted to drip irrigation as shown in Fig. 10.
Earlier, agriculture farming was based on open well, tank, and rainfed system, but
now due to overexploitation of ground water, it leads to adaptation of new technologies to conserve water (Fig. 10).
Indicator 15: Area Under Wasteland
Data pertaining to ‘area under waste land’ shows an overall decrease of waste lands
by 5 %. The change in waste land corresponds to the change in agricultural land as
presented in Table 15. Vadigehalli, which shows a decrease in agricultural land,
also shows a corresponding increase in waste land, while all other villages with an
increase registered in agricultural land show a decrease in waste land.
The percentage of waste land in the study area is considerably high, ranging
from 20 to 35 %.
Fig. 10 Drip irrigation system for vegetable and flower cropping. Source Authors, 2014
Table 15 Area under waste
land
Village name
Percentage of
area under
wasteland (%)
Percentage
change
1991
2001
Jadigenahalli
26.67
24.52
−2.15
Haralur
28.21
23.95
−4.25
Vadigehalli
37.68
36.32
−1.36
Karibeeranahosahalli
50.50
31.43
−19.07
Govindapura
29.60
22.63
−6.98
Total
28.00
22.96
−5.04
Source Census of India
494
S. Manasi et al.
growing vegetables and flowers have adopted to drip irrigation as shown in Fig. 10.
Earlier, agriculture farming was based on open well, tank, and rainfed system, but
now due to overexploitation of ground water, it leads to adaptation of new technologies to conserve water (Fig. 10).
Indicator 15: Area Under Wasteland
Data pertaining to ‘area under waste land’ shows an overall decrease of waste lands
by 5 %. The change in waste land corresponds to the change in agricultural land as
presented in Table 15. Vadigehalli, which shows a decrease in agricultural land,
also shows a corresponding increase in waste land, while all other villages with an
increase registered in agricultural land show a decrease in waste land.
The percentage of waste land in the study area is considerably high, ranging
from 20 to 35 %.
Fig. 10 Drip irrigation system for vegetable and flower cropping. Source Authors, 2014
Table 15 Area under waste
land
Village name
Percentage of
area under
wasteland (%)
Percentage
change
1991
2001
Jadigenahalli
26.67
24.52
−2.15
Haralur
28.21
23.95
−4.25
Vadigehalli
37.68
36.32
−1.36
Karibeeranahosahalli
50.50
31.43
−19.07
Govindapura
29.60
22.63
−6.98
Total
28.00
22.96
−5.04
Source Census of India
494
S. Manasi et al.