

now only one lake/water body exits in Govindapura, which dramatically brought
down the water holding capacity in the region and also water recharge capacity.
Along with this there was a decreased moisture content retention capacity of the soil
system and heavy/overexploitation of ground water for agricultural activities.
This shows less awareness among villagers about water usage and conservation
(each farmer, on an average, owns 6 bore wells) in terms of cultivating more crops,
leading to a depletion of ground water levels. Further, de-silting of lakes for brick
making industrial units (there are 500–600 brick making units spread across
Jadigenahalli to Malur) has reduced water storage in lakes which cannot be
attributed to climate change.
Indicator 2: Annual ‘Max’ Temperature
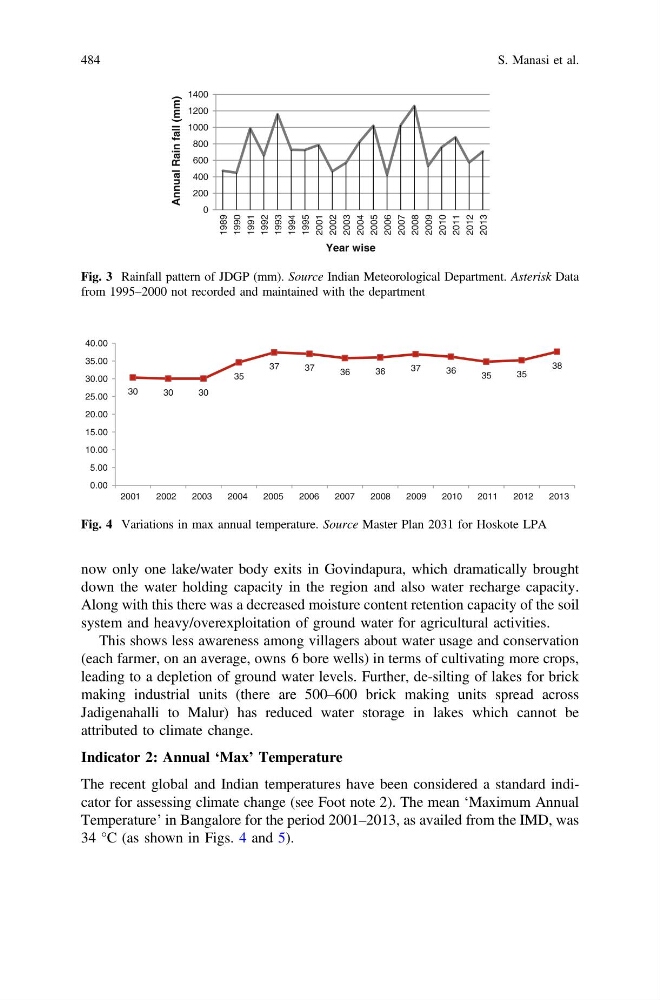
The recent global and Indian temperatures have been considered a standard indicator for assessing climate change (see Foot note 2). The mean ‘Maximum Annual
Temperature’ in Bangalore for the period 2001–2013, as availed from the IMD, was
34 °C (as shown in Figs. 4 and 5).
0
200
400
600
800
1000
1200
1400
1989
1990
1991
1992
1993
1994
1995
2001
2002
2003
2004
2005
2006
2007
2008
2009
2010
2011
2012
2013
Annual Rain fall (mm)
Year wise
Fig. 3 Rainfall pattern of JDGP (mm). Source Indian Meteorological Department. Asterisk Data
from 1995–2000 not recorded and maintained with the department
30
30
30
35
37
37
36
36
37
36
35
35
38
0.00
5.00
10.00
15.00
20.00
25.00
30.00
35.00
40.00
2001
2002
2003
2004
2005
2006
2007
2008
2009
2010
2011
2012
2013
Fig. 4 Variations in max annual temperature. Source Master Plan 2031 for Hoskote LPA
484
S. Manasi et al.
down the water holding capacity in the region and also water recharge capacity.
Along with this there was a decreased moisture content retention capacity of the soil
system and heavy/overexploitation of ground water for agricultural activities.
This shows less awareness among villagers about water usage and conservation
(each farmer, on an average, owns 6 bore wells) in terms of cultivating more crops,
leading to a depletion of ground water levels. Further, de-silting of lakes for brick
making industrial units (there are 500–600 brick making units spread across
Jadigenahalli to Malur) has reduced water storage in lakes which cannot be
attributed to climate change.
Indicator 2: Annual ‘Max’ Temperature
The recent global and Indian temperatures have been considered a standard indicator for assessing climate change (see Foot note 2). The mean ‘Maximum Annual
Temperature’ in Bangalore for the period 2001–2013, as availed from the IMD, was
34 °C (as shown in Figs. 4 and 5).
0
200
400
600
800
1000
1200
1400
1989
1990
1991
1992
1993
1994
1995
2001
2002
2003
2004
2005
2006
2007
2008
2009
2010
2011
2012
2013
Annual Rain fall (mm)
Year wise
Fig. 3 Rainfall pattern of JDGP (mm). Source Indian Meteorological Department. Asterisk Data
from 1995–2000 not recorded and maintained with the department
30
30
30
35
37
37
36
36
37
36
35
35
38
0.00
5.00
10.00
15.00
20.00
25.00
30.00
35.00
40.00
2001
2002
2003
2004
2005
2006
2007
2008
2009
2010
2011
2012
2013
Fig. 4 Variations in max annual temperature. Source Master Plan 2031 for Hoskote LPA
484
S. Manasi et al.