

regulations. However, adaptation can be efficient to reduce some climate change
impacts. For instance, Netherlands is experiencing a sea level rise of 0.2 m a
century. After the 1953 great flood, institutional and legal innovations were
implemented to manage future risks. Climate change is now naturally taken into
account, and flooding risks are monitored and managed on regular basis.
Keeping in mind the present condition of Mumbai’s infrastructure, which is
dilapidated and set for an overhaul, it is crucial to factor in climate change and then
make long-term investments in sectors, such as water management; sewerage;
energy production and distribution infrastructure; transportation infrastructure;
urbanism, housing and architecture; and natural disaster protections. This will help
the city adapt and deal with the challenges of climate change.
Box 1: More Floods, No Winter
In its 2009 report, Environmental degradation, disasters and climate change,
the India Meteorological Department’s (IMD) regional team at Mumbai
analyzed 100 years of weather data from 1901 onwards and found a rise of
1.62◦C in the average maximum temperature of Mumbai. Winters are already
giving Mumbai a miss, claimed this report. IMD also noted that from 2001
onwards rainfall over Mumbai has increased. This could be due to a change in
the lapse rate or the rate of change of any meteorological element (temperature in this case) with altitude. The lapse rate determines the growth of
clouds. The lapse rate is increasing with the cooling of air in the upper
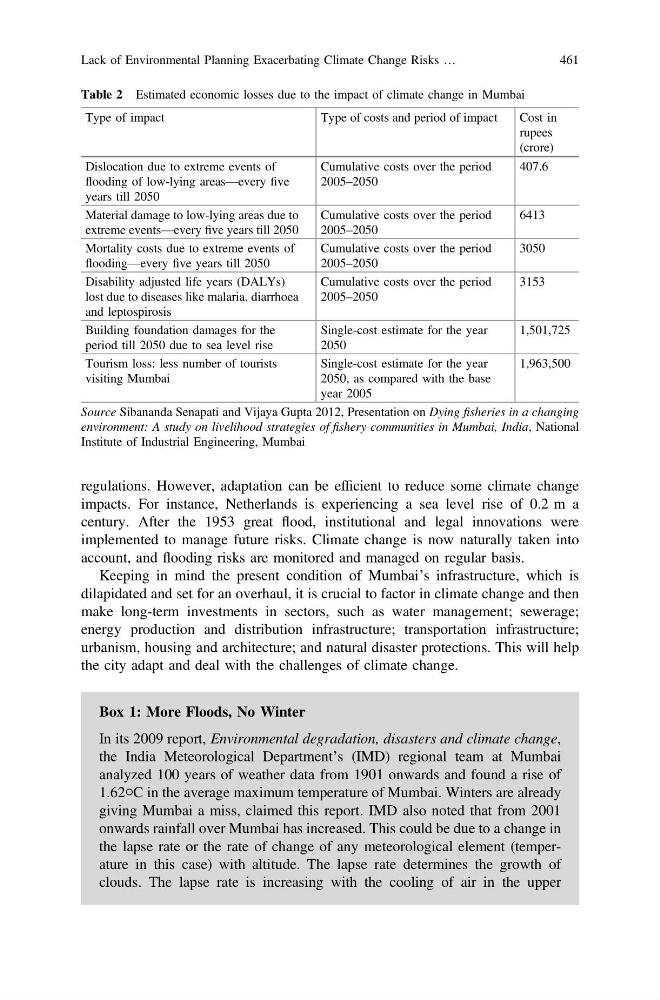
Table 2 Estimated economic losses due to the impact of climate change in Mumbai
Type of impact
Type of costs and period of impact
Cost in
rupees
(crore)
Dislocation due to extreme events of
flooding of low-lying areas—every five
years till 2050
Cumulative costs over the period
2005–2050
407.6
Material damage to low-lying areas due to
extreme events—every five years till 2050
Cumulative costs over the period
2005–2050
6413
Mortality costs due to extreme events of
flooding—every five years till 2050
Cumulative costs over the period
2005–2050
3050
Disability adjusted life years (DALYs)
lost due to diseases like malaria, diarrhoea
and leptospirosis
Cumulative costs over the period
2005–2050
3153
Building foundation damages for the
period till 2050 due to sea level rise
Single-cost estimate for the year
2050
1,501,725
Tourism loss: less number of tourists
visiting Mumbai
Single-cost estimate for the year
2050, as compared with the base
year 2005
1,963,500
Source Sibananda Senapati and Vijaya Gupta 2012, Presentation on Dying fisheries in a changing
environment: A study on livelihood strategies of fishery communities in Mumbai, India, National
Institute of Industrial Engineering, Mumbai
Lack of Environmental Planning Exacerbating Climate Change Risks …
461
impacts. For instance, Netherlands is experiencing a sea level rise of 0.2 m a
century. After the 1953 great flood, institutional and legal innovations were
implemented to manage future risks. Climate change is now naturally taken into
account, and flooding risks are monitored and managed on regular basis.
Keeping in mind the present condition of Mumbai’s infrastructure, which is
dilapidated and set for an overhaul, it is crucial to factor in climate change and then
make long-term investments in sectors, such as water management; sewerage;
energy production and distribution infrastructure; transportation infrastructure;
urbanism, housing and architecture; and natural disaster protections. This will help
the city adapt and deal with the challenges of climate change.
Box 1: More Floods, No Winter
In its 2009 report, Environmental degradation, disasters and climate change,
the India Meteorological Department’s (IMD) regional team at Mumbai
analyzed 100 years of weather data from 1901 onwards and found a rise of
1.62◦C in the average maximum temperature of Mumbai. Winters are already
giving Mumbai a miss, claimed this report. IMD also noted that from 2001
onwards rainfall over Mumbai has increased. This could be due to a change in
the lapse rate or the rate of change of any meteorological element (temperature in this case) with altitude. The lapse rate determines the growth of
clouds. The lapse rate is increasing with the cooling of air in the upper
Table 2 Estimated economic losses due to the impact of climate change in Mumbai
Type of impact
Type of costs and period of impact
Cost in
rupees
(crore)
Dislocation due to extreme events of
flooding of low-lying areas—every five
years till 2050
Cumulative costs over the period
2005–2050
407.6
Material damage to low-lying areas due to
extreme events—every five years till 2050
Cumulative costs over the period
2005–2050
6413
Mortality costs due to extreme events of
flooding—every five years till 2050
Cumulative costs over the period
2005–2050
3050
Disability adjusted life years (DALYs)
lost due to diseases like malaria, diarrhoea
and leptospirosis
Cumulative costs over the period
2005–2050
3153
Building foundation damages for the
period till 2050 due to sea level rise
Single-cost estimate for the year
2050
1,501,725
Tourism loss: less number of tourists
visiting Mumbai
Single-cost estimate for the year
2050, as compared with the base
year 2005
1,963,500
Source Sibananda Senapati and Vijaya Gupta 2012, Presentation on Dying fisheries in a changing
environment: A study on livelihood strategies of fishery communities in Mumbai, India, National
Institute of Industrial Engineering, Mumbai
Lack of Environmental Planning Exacerbating Climate Change Risks …
461