

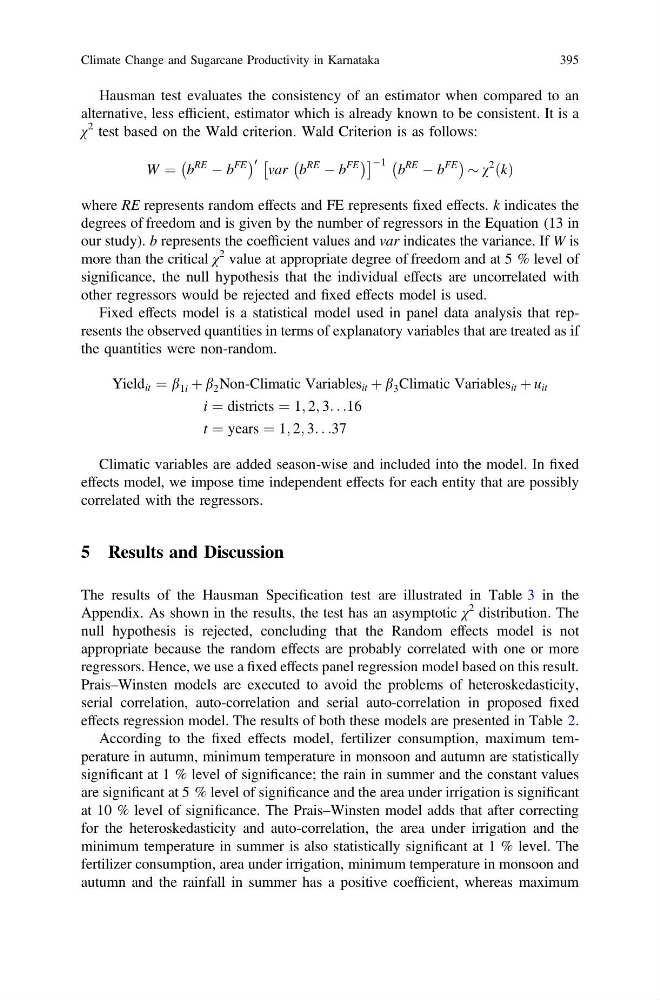
Hausman test evaluates the consistency of an estimator when compared to an
alternative, less efficient, estimator which is already known to be consistent. It is a
χ
2 test based on the Wald criterion. Wald Criterion is as follows:
W ¼ b
RE
À b
FE
À
Á 0 var b
RE
À b
FE
À
Á
Â
à À1 b
RE
À b
FE
À
Á $ v
2
ðkÞ
where RE represents random effects and FE represents fixed effects. k indicates the
degrees of freedom and is given by the number of regressors in the Equation (13 in
our study). b represents the coefficient values and var indicates the variance. If W is
more than the critical χ
2 value at appropriate degree of freedom and at 5 % level of
significance, the null hypothesis that the individual effects are uncorrelated with
other regressors would be rejected and fixed effects model is used.
Fixed effects model is a statistical model used in panel data analysis that represents the observed quantities in terms of explanatory variables that are treated as if
the quantities were non-random.
Yield it ¼ b 1i þ b 2 Non-Climatic Variables it þ b 3 Climatic Variables it þ u it
i ¼ districts ¼ 1; 2; 3. . .16
t ¼ years ¼ 1; 2; 3. . .37
Climatic variables are added season-wise and included into the model. In fixed
effects model, we impose time independent effects for each entity that are possibly
correlated with the regressors.
5 Results and Discussion
The results of the Hausman Specification test are illustrated in Table 3 in the
Appendix. As shown in the results, the test has an asymptotic χ
2 distribution. The
null hypothesis is rejected, concluding that the Random effects model is not
appropriate because the random effects are probably correlated with one or more
regressors. Hence, we use a fixed effects panel regression model based on this result.
Prais–Winsten models are executed to avoid the problems of heteroskedasticity,
serial correlation, auto-correlation and serial auto-correlation in proposed fixed
effects regression model. The results of both these models are presented in Table 2.
According to the fixed effects model, fertilizer consumption, maximum temperature in autumn, minimum temperature in monsoon and autumn are statistically
significant at 1 % level of significance; the rain in summer and the constant values
are significant at 5 % level of significance and the area under irrigation is significant
at 10 % level of significance. The Prais–Winsten model adds that after correcting
for the heteroskedasticity and auto-correlation, the area under irrigation and the
minimum temperature in summer is also statistically significant at 1 % level. The
fertilizer consumption, area under irrigation, minimum temperature in monsoon and
autumn and the rainfall in summer has a positive coefficient, whereas maximum
Climate Change and Sugarcane Productivity in Karnataka
395
alternative, less efficient, estimator which is already known to be consistent. It is a
χ
2 test based on the Wald criterion. Wald Criterion is as follows:
W ¼ b
RE
À b
FE
À
Á 0 var b
RE
À b
FE
À
Á
Â
à À1 b
RE
À b
FE
À
Á $ v
2
ðkÞ
where RE represents random effects and FE represents fixed effects. k indicates the
degrees of freedom and is given by the number of regressors in the Equation (13 in
our study). b represents the coefficient values and var indicates the variance. If W is
more than the critical χ
2 value at appropriate degree of freedom and at 5 % level of
significance, the null hypothesis that the individual effects are uncorrelated with
other regressors would be rejected and fixed effects model is used.
Fixed effects model is a statistical model used in panel data analysis that represents the observed quantities in terms of explanatory variables that are treated as if
the quantities were non-random.
Yield it ¼ b 1i þ b 2 Non-Climatic Variables it þ b 3 Climatic Variables it þ u it
i ¼ districts ¼ 1; 2; 3. . .16
t ¼ years ¼ 1; 2; 3. . .37
Climatic variables are added season-wise and included into the model. In fixed
effects model, we impose time independent effects for each entity that are possibly
correlated with the regressors.
5 Results and Discussion
The results of the Hausman Specification test are illustrated in Table 3 in the
Appendix. As shown in the results, the test has an asymptotic χ
2 distribution. The
null hypothesis is rejected, concluding that the Random effects model is not
appropriate because the random effects are probably correlated with one or more
regressors. Hence, we use a fixed effects panel regression model based on this result.
Prais–Winsten models are executed to avoid the problems of heteroskedasticity,
serial correlation, auto-correlation and serial auto-correlation in proposed fixed
effects regression model. The results of both these models are presented in Table 2.
According to the fixed effects model, fertilizer consumption, maximum temperature in autumn, minimum temperature in monsoon and autumn are statistically
significant at 1 % level of significance; the rain in summer and the constant values
are significant at 5 % level of significance and the area under irrigation is significant
at 10 % level of significance. The Prais–Winsten model adds that after correcting
for the heteroskedasticity and auto-correlation, the area under irrigation and the
minimum temperature in summer is also statistically significant at 1 % level. The
fertilizer consumption, area under irrigation, minimum temperature in monsoon and
autumn and the rainfall in summer has a positive coefficient, whereas maximum
Climate Change and Sugarcane Productivity in Karnataka
395