

(PM 2.5 , PM 10 , TSPM), gaseous pollutants (SO 2 , NO X , NH 3 , CO, Ozone, THC, TC,
and BTX), and heavy metals.
2
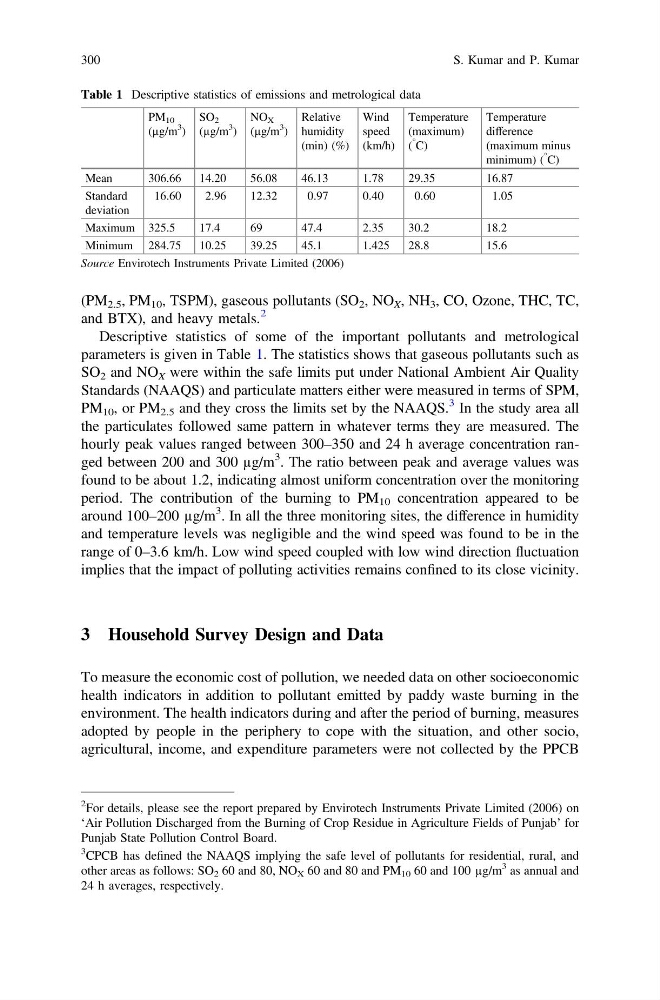
Descriptive statistics of some of the important pollutants and metrological
parameters is given in Table 1. The statistics shows that gaseous pollutants such as
SO 2 and NO X were within the safe limits put under National Ambient Air Quality
Standards (NAAQS) and particulate matters either were measured in terms of SPM,
PM 10 , or PM 2.5 and they cross the limits set by the NAAQS.
3 In the study area all
the particulates followed same pattern in whatever terms they are measured. The
hourly peak values ranged between 300–350 and 24 h average concentration ranged between 200 and 300 µg/m
3 . The ratio between peak and average values was
found to be about 1.2, indicating almost uniform concentration over the monitoring
period. The contribution of the burning to PM 10 concentration appeared to be
around 100–200 µg/m
3 . In all the three monitoring sites, the difference in humidity
and temperature levels was negligible and the wind speed was found to be in the
range of 0–3.6 km/h. Low wind speed coupled with low wind direction fluctuation
implies that the impact of polluting activities remains confined to its close vicinity.
3 Household Survey Design and Data
To measure the economic cost of pollution, we needed data on other socioeconomic
health indicators in addition to pollutant emitted by paddy waste burning in the
environment. The health indicators during and after the period of burning, measures
adopted by people in the periphery to cope with the situation, and other socio,
agricultural, income, and expenditure parameters were not collected by the PPCB
Table 1 Descriptive statistics of emissions and metrological data
PM 10
(µg/m
3 )
SO 2
(µg/m
3 )
NO X
(µg/m
3
)
Relative
humidity
(min) (%)
Wind
speed
(km/h)
Temperature
(maximum)
(
° C)
Temperature
difference
(maximum minus
minimum) (
° C)
Mean
306.66
14.20
56.08
46.13
1.78
29.35
16.87
Standard
deviation
16.60
2.96
12.32
0.97
0.40
0.60
1.05
Maximum 325.5
17.4
69
47.4
2.35
30.2
18.2
Minimum 284.75
10.25
39.25
45.1
1.425
28.8
15.6
Source Envirotech Instruments Private Limited (2006)
2
For details, please see the report prepared by Envirotech Instruments Private Limited (2006) on
‘Air Pollution Discharged from the Burning of Crop Residue in Agriculture Fields of Punjab’ for
Punjab State Pollution Control Board.
3
CPCB has defined the NAAQS implying the safe level of pollutants for residential, rural, and
other areas as follows: SO 2 60 and 80, NO X 60 and 80 and PM 10 60 and 100 µg/m
3 as annual and
24 h averages, respectively.
300
S. Kumar and P. Kumar
and BTX), and heavy metals.
2
Descriptive statistics of some of the important pollutants and metrological
parameters is given in Table 1. The statistics shows that gaseous pollutants such as
SO 2 and NO X were within the safe limits put under National Ambient Air Quality
Standards (NAAQS) and particulate matters either were measured in terms of SPM,
PM 10 , or PM 2.5 and they cross the limits set by the NAAQS.
3 In the study area all
the particulates followed same pattern in whatever terms they are measured. The
hourly peak values ranged between 300–350 and 24 h average concentration ranged between 200 and 300 µg/m
3 . The ratio between peak and average values was
found to be about 1.2, indicating almost uniform concentration over the monitoring
period. The contribution of the burning to PM 10 concentration appeared to be
around 100–200 µg/m
3 . In all the three monitoring sites, the difference in humidity
and temperature levels was negligible and the wind speed was found to be in the
range of 0–3.6 km/h. Low wind speed coupled with low wind direction fluctuation
implies that the impact of polluting activities remains confined to its close vicinity.
3 Household Survey Design and Data
To measure the economic cost of pollution, we needed data on other socioeconomic
health indicators in addition to pollutant emitted by paddy waste burning in the
environment. The health indicators during and after the period of burning, measures
adopted by people in the periphery to cope with the situation, and other socio,
agricultural, income, and expenditure parameters were not collected by the PPCB
Table 1 Descriptive statistics of emissions and metrological data
PM 10
(µg/m
3 )
SO 2
(µg/m
3 )
NO X
(µg/m
3
)
Relative
humidity
(min) (%)
Wind
speed
(km/h)
Temperature
(maximum)
(
° C)
Temperature
difference
(maximum minus
minimum) (
° C)
Mean
306.66
14.20
56.08
46.13
1.78
29.35
16.87
Standard
deviation
16.60
2.96
12.32
0.97
0.40
0.60
1.05
Maximum 325.5
17.4
69
47.4
2.35
30.2
18.2
Minimum 284.75
10.25
39.25
45.1
1.425
28.8
15.6
Source Envirotech Instruments Private Limited (2006)
2
For details, please see the report prepared by Envirotech Instruments Private Limited (2006) on
‘Air Pollution Discharged from the Burning of Crop Residue in Agriculture Fields of Punjab’ for
Punjab State Pollution Control Board.
3
CPCB has defined the NAAQS implying the safe level of pollutants for residential, rural, and
other areas as follows: SO 2 60 and 80, NO X 60 and 80 and PM 10 60 and 100 µg/m
3 as annual and
24 h averages, respectively.
300
S. Kumar and P. Kumar