

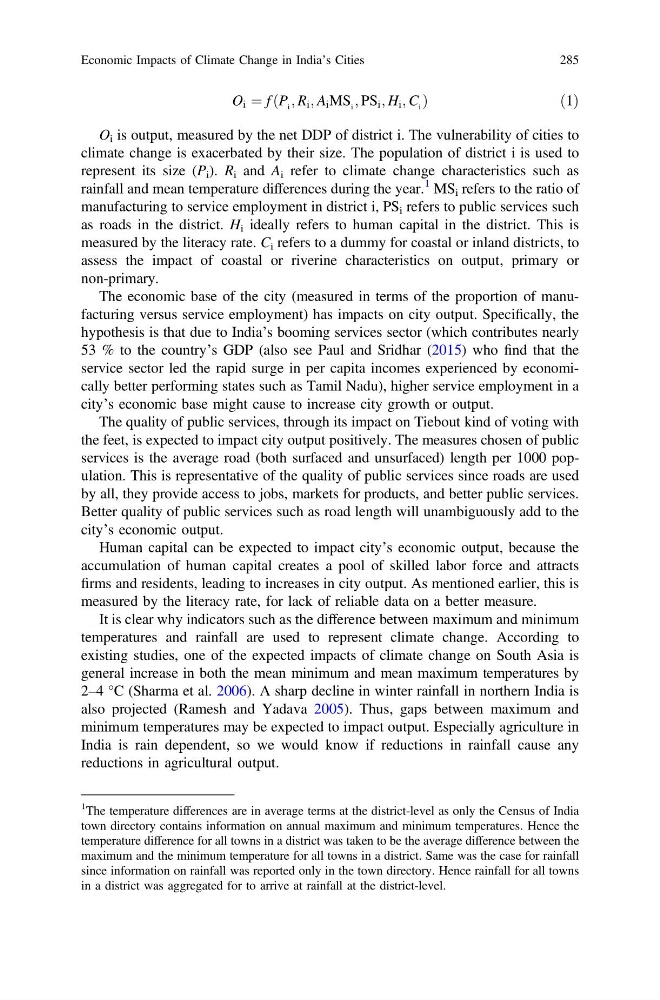
O i ¼ f P i ; R i ; A i MS i ; PS i ; H i ; C i
ð
Þ
ð 1Þ
O i is output, measured by the net DDP of district i. The vulnerability of cities to
climate change is exacerbated by their size. The population of district i is used to
represent its size (P i ). R i and A i refer to climate change characteristics such as
rainfall and mean temperature differences during the year.
1 MS i refers to the ratio of
manufacturing to service employment in district i, PS i refers to public services such
as roads in the district. H i ideally refers to human capital in the district. This is
measured by the literacy rate. C i refers to a dummy for coastal or inland districts, to
assess the impact of coastal or riverine characteristics on output, primary or
non-primary.
The economic base of the city (measured in terms of the proportion of manufacturing versus service employment) has impacts on city output. Specifically, the
hypothesis is that due to India’s booming services sector (which contributes nearly
53 % to the country’s GDP (also see Paul and Sridhar (2015) who find that the
service sector led the rapid surge in per capita incomes experienced by economically better performing states such as Tamil Nadu), higher service employment in a
city’s economic base might cause to increase city growth or output.
The quality of public services, through its impact on Tiebout kind of voting with
the feet, is expected to impact city output positively. The measures chosen of public
services is the average road (both surfaced and unsurfaced) length per 1000 population. This is representative of the quality of public services since roads are used
by all, they provide access to jobs, markets for products, and better public services.
Better quality of public services such as road length will unambiguously add to the
city’s economic output.
Human capital can be expected to impact city’s economic output, because the
accumulation of human capital creates a pool of skilled labor force and attracts
firms and residents, leading to increases in city output. As mentioned earlier, this is
measured by the literacy rate, for lack of reliable data on a better measure.
It is clear why indicators such as the difference between maximum and minimum
temperatures and rainfall are used to represent climate change. According to
existing studies, one of the expected impacts of climate change on South Asia is
general increase in both the mean minimum and mean maximum temperatures by
2–4 °C (Sharma et al. 2006). A sharp decline in winter rainfall in northern India is
also projected (Ramesh and Yadava 2005). Thus, gaps between maximum and
minimum temperatures may be expected to impact output. Especially agriculture in
India is rain dependent, so we would know if reductions in rainfall cause any
reductions in agricultural output.
1
The temperature differences are in average terms at the district-level as only the Census of India
town directory contains information on annual maximum and minimum temperatures. Hence the
temperature difference for all towns in a district was taken to be the average difference between the
maximum and the minimum temperature for all towns in a district. Same was the case for rainfall
since information on rainfall was reported only in the town directory. Hence rainfall for all towns
in a district was aggregated for to arrive at rainfall at the district-level.
Economic Impacts of Climate Change in India’s Cities
285
ð
Þ
ð 1Þ
O i is output, measured by the net DDP of district i. The vulnerability of cities to
climate change is exacerbated by their size. The population of district i is used to
represent its size (P i ). R i and A i refer to climate change characteristics such as
rainfall and mean temperature differences during the year.
1 MS i refers to the ratio of
manufacturing to service employment in district i, PS i refers to public services such
as roads in the district. H i ideally refers to human capital in the district. This is
measured by the literacy rate. C i refers to a dummy for coastal or inland districts, to
assess the impact of coastal or riverine characteristics on output, primary or
non-primary.
The economic base of the city (measured in terms of the proportion of manufacturing versus service employment) has impacts on city output. Specifically, the
hypothesis is that due to India’s booming services sector (which contributes nearly
53 % to the country’s GDP (also see Paul and Sridhar (2015) who find that the
service sector led the rapid surge in per capita incomes experienced by economically better performing states such as Tamil Nadu), higher service employment in a
city’s economic base might cause to increase city growth or output.
The quality of public services, through its impact on Tiebout kind of voting with
the feet, is expected to impact city output positively. The measures chosen of public
services is the average road (both surfaced and unsurfaced) length per 1000 population. This is representative of the quality of public services since roads are used
by all, they provide access to jobs, markets for products, and better public services.
Better quality of public services such as road length will unambiguously add to the
city’s economic output.
Human capital can be expected to impact city’s economic output, because the
accumulation of human capital creates a pool of skilled labor force and attracts
firms and residents, leading to increases in city output. As mentioned earlier, this is
measured by the literacy rate, for lack of reliable data on a better measure.
It is clear why indicators such as the difference between maximum and minimum
temperatures and rainfall are used to represent climate change. According to
existing studies, one of the expected impacts of climate change on South Asia is
general increase in both the mean minimum and mean maximum temperatures by
2–4 °C (Sharma et al. 2006). A sharp decline in winter rainfall in northern India is
also projected (Ramesh and Yadava 2005). Thus, gaps between maximum and
minimum temperatures may be expected to impact output. Especially agriculture in
India is rain dependent, so we would know if reductions in rainfall cause any
reductions in agricultural output.
1
The temperature differences are in average terms at the district-level as only the Census of India
town directory contains information on annual maximum and minimum temperatures. Hence the
temperature difference for all towns in a district was taken to be the average difference between the
maximum and the minimum temperature for all towns in a district. Same was the case for rainfall
since information on rainfall was reported only in the town directory. Hence rainfall for all towns
in a district was aggregated for to arrive at rainfall at the district-level.
Economic Impacts of Climate Change in India’s Cities
285