

addition, irrigation can go a long way and we have seen the significant difference
between the farmers having access to irrigation facilities and those who do not. Risk
mitigation strategies like insurance coverage are essential; but at present insurance
coverage is very meager, and this issue will be taken up for a detailed discussion in
the sequel hereto.
6 Price-Related Uncertainties
As mentioned earlier, in addition to weather and disease related uncertainties,
farmers also face price-related uncertainties, and the study covers this issue as well.
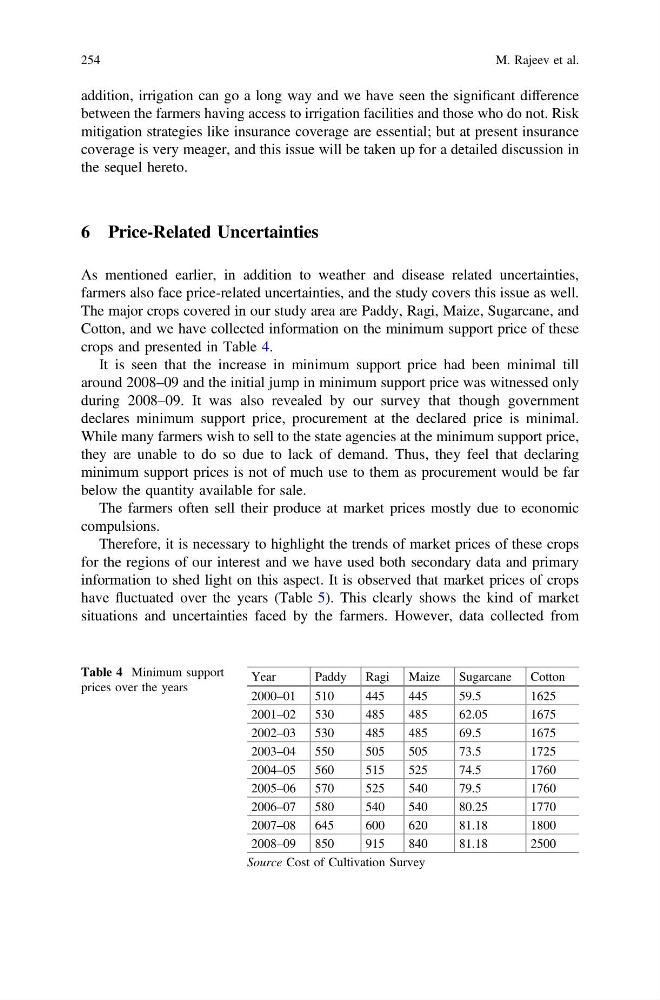
The major crops covered in our study area are Paddy, Ragi, Maize, Sugarcane, and
Cotton, and we have collected information on the minimum support price of these
crops and presented in Table 4.
It is seen that the increase in minimum support price had been minimal till
around 2008–09 and the initial jump in minimum support price was witnessed only
during 2008–09. It was also revealed by our survey that though government
declares minimum support price, procurement at the declared price is minimal.
While many farmers wish to sell to the state agencies at the minimum support price,
they are unable to do so due to lack of demand. Thus, they feel that declaring
minimum support prices is not of much use to them as procurement would be far
below the quantity available for sale.
The farmers often sell their produce at market prices mostly due to economic
compulsions.
Therefore, it is necessary to highlight the trends of market prices of these crops
for the regions of our interest and we have used both secondary data and primary
information to shed light on this aspect. It is observed that market prices of crops
have fluctuated over the years (Table 5). This clearly shows the kind of market
situations and uncertainties faced by the farmers. However, data collected from
Table 4 Minimum support
prices over the years
Year
Paddy
Ragi
Maize
Sugarcane
Cotton
2000–01 510
445
445
59.5
1625
2001–02 530
485
485
62.05
1675
2002–03 530
485
485
69.5
1675
2003–04 550
505
505
73.5
1725
2004–05 560
515
525
74.5
1760
2005–06 570
525
540
79.5
1760
2006–07 580
540
540
80.25
1770
2007–08 645
600
620
81.18
1800
2008–09 850
915
840
81.18
2500
Source Cost of Cultivation Survey
254
M. Rajeev et al.
between the farmers having access to irrigation facilities and those who do not. Risk
mitigation strategies like insurance coverage are essential; but at present insurance
coverage is very meager, and this issue will be taken up for a detailed discussion in
the sequel hereto.
6 Price-Related Uncertainties
As mentioned earlier, in addition to weather and disease related uncertainties,
farmers also face price-related uncertainties, and the study covers this issue as well.
The major crops covered in our study area are Paddy, Ragi, Maize, Sugarcane, and
Cotton, and we have collected information on the minimum support price of these
crops and presented in Table 4.
It is seen that the increase in minimum support price had been minimal till
around 2008–09 and the initial jump in minimum support price was witnessed only
during 2008–09. It was also revealed by our survey that though government
declares minimum support price, procurement at the declared price is minimal.
While many farmers wish to sell to the state agencies at the minimum support price,
they are unable to do so due to lack of demand. Thus, they feel that declaring
minimum support prices is not of much use to them as procurement would be far
below the quantity available for sale.
The farmers often sell their produce at market prices mostly due to economic
compulsions.
Therefore, it is necessary to highlight the trends of market prices of these crops
for the regions of our interest and we have used both secondary data and primary
information to shed light on this aspect. It is observed that market prices of crops
have fluctuated over the years (Table 5). This clearly shows the kind of market
situations and uncertainties faced by the farmers. However, data collected from
Table 4 Minimum support
prices over the years
Year
Paddy
Ragi
Maize
Sugarcane
Cotton
2000–01 510
445
445
59.5
1625
2001–02 530
485
485
62.05
1675
2002–03 530
485
485
69.5
1675
2003–04 550
505
505
73.5
1725
2004–05 560
515
525
74.5
1760
2005–06 570
525
540
79.5
1760
2006–07 580
540
540
80.25
1770
2007–08 645
600
620
81.18
1800
2008–09 850
915
840
81.18
2500
Source Cost of Cultivation Survey
254
M. Rajeev et al.