

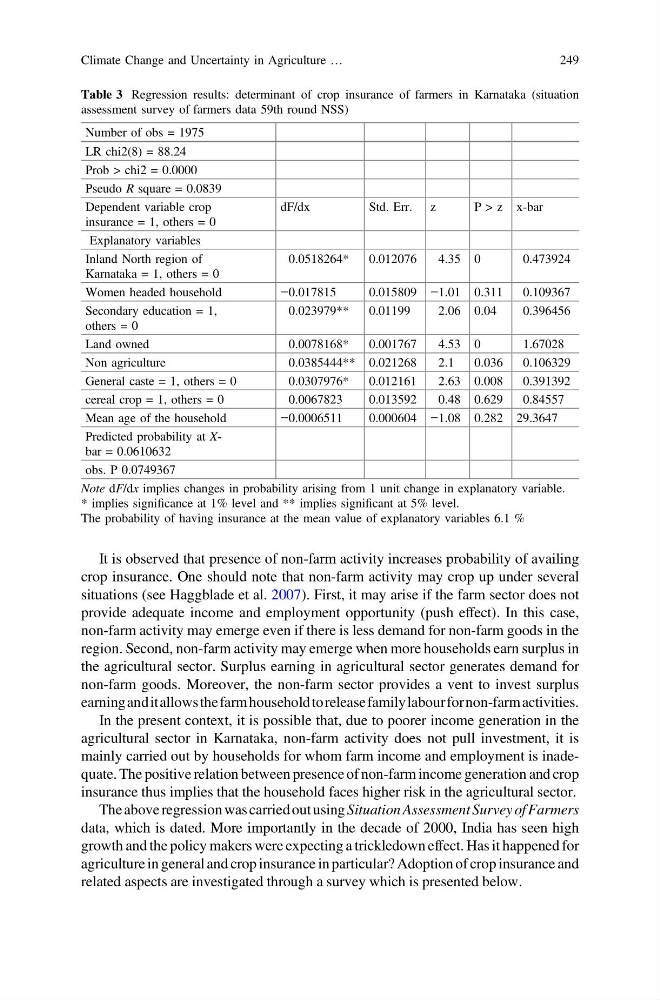
It is observed that presence of non-farm activity increases probability of availing
crop insurance. One should note that non-farm activity may crop up under several
situations (see Haggblade et al. 2007). First, it may arise if the farm sector does not
provide adequate income and employment opportunity (push effect). In this case,
non-farm activity may emerge even if there is less demand for non-farm goods in the
region. Second, non-farm activity may emerge when more households earn surplus in
the agricultural sector. Surplus earning in agricultural sector generates demand for
non-farm goods. Moreover, the non-farm sector provides a vent to invest surplus
earningandit allows the farm household to release family labour for non-farm activities.
In the present context, it is possible that, due to poorer income generation in the
agricultural sector in Karnataka, non-farm activity does not pull investment, it is
mainly carried out by households for whom farm income and employment is inadequate. The positive relation between presence of non-farm income generation and crop
insurance thus implies that the household faces higher risk in the agricultural sector.
The above regression was carried out using Situation Assessment Survey of Farmers
data, which is dated. More importantly in the decade of 2000, India has seen high
growth and the policy makers were expecting a trickledown effect. Has it happened for
agriculture in general and crop insurance in particular? Adoption of crop insurance and
related aspects are investigated through a survey which is presented below.
Table 3 Regression results: determinant of crop insurance of farmers in Karnataka (situation
assessment survey of farmers data 59th round NSS)
Number of obs = 1975
LR chi2(8) = 88.24
Prob > chi2 = 0.0000
Pseudo R square = 0.0839
Dependent variable crop
insurance = 1, others = 0
dF/dx
Std. Err. z
P > z x-bar
Explanatory variables
Inland North region of
Karnataka = 1, others = 0
0.0518264*
0.012076
4.35 0
0.473924
Women headed household
−0.017815
0.015809 −1.01 0.311
0.109367
Secondary education = 1,
others = 0
0.023979**
0.01199
2.06 0.04
0.396456
Land owned
0.0078168*
0.001767
4.53 0
1.67028
Non agriculture
0.0385444** 0.021268
2.1
0.036
0.106329
General caste = 1, others = 0
0.0307976*
0.012161
2.63 0.008
0.391392
cereal crop = 1, others = 0
0.0067823
0.013592
0.48 0.629
0.84557
Mean age of the household
−0.0006511
0.000604 −1.08 0.282 29.3647
Predicted probability at Xbar = 0.0610632
obs. P 0.0749367
Note dF/dx implies changes in probability arising from 1 unit change in explanatory variable.
* implies significance at 1% level and ** implies significant at 5% level.
The probability of having insurance at the mean value of explanatory variables 6.1 %
Climate Change and Uncertainty in Agriculture …
249
crop insurance. One should note that non-farm activity may crop up under several
situations (see Haggblade et al. 2007). First, it may arise if the farm sector does not
provide adequate income and employment opportunity (push effect). In this case,
non-farm activity may emerge even if there is less demand for non-farm goods in the
region. Second, non-farm activity may emerge when more households earn surplus in
the agricultural sector. Surplus earning in agricultural sector generates demand for
non-farm goods. Moreover, the non-farm sector provides a vent to invest surplus
earningandit allows the farm household to release family labour for non-farm activities.
In the present context, it is possible that, due to poorer income generation in the
agricultural sector in Karnataka, non-farm activity does not pull investment, it is
mainly carried out by households for whom farm income and employment is inadequate. The positive relation between presence of non-farm income generation and crop
insurance thus implies that the household faces higher risk in the agricultural sector.
The above regression was carried out using Situation Assessment Survey of Farmers
data, which is dated. More importantly in the decade of 2000, India has seen high
growth and the policy makers were expecting a trickledown effect. Has it happened for
agriculture in general and crop insurance in particular? Adoption of crop insurance and
related aspects are investigated through a survey which is presented below.
Table 3 Regression results: determinant of crop insurance of farmers in Karnataka (situation
assessment survey of farmers data 59th round NSS)
Number of obs = 1975
LR chi2(8) = 88.24
Prob > chi2 = 0.0000
Pseudo R square = 0.0839
Dependent variable crop
insurance = 1, others = 0
dF/dx
Std. Err. z
P > z x-bar
Explanatory variables
Inland North region of
Karnataka = 1, others = 0
0.0518264*
0.012076
4.35 0
0.473924
Women headed household
−0.017815
0.015809 −1.01 0.311
0.109367
Secondary education = 1,
others = 0
0.023979**
0.01199
2.06 0.04
0.396456
Land owned
0.0078168*
0.001767
4.53 0
1.67028
Non agriculture
0.0385444** 0.021268
2.1
0.036
0.106329
General caste = 1, others = 0
0.0307976*
0.012161
2.63 0.008
0.391392
cereal crop = 1, others = 0
0.0067823
0.013592
0.48 0.629
0.84557
Mean age of the household
−0.0006511
0.000604 −1.08 0.282 29.3647
Predicted probability at Xbar = 0.0610632
obs. P 0.0749367
Note dF/dx implies changes in probability arising from 1 unit change in explanatory variable.
* implies significance at 1% level and ** implies significant at 5% level.
The probability of having insurance at the mean value of explanatory variables 6.1 %
Climate Change and Uncertainty in Agriculture …
249