

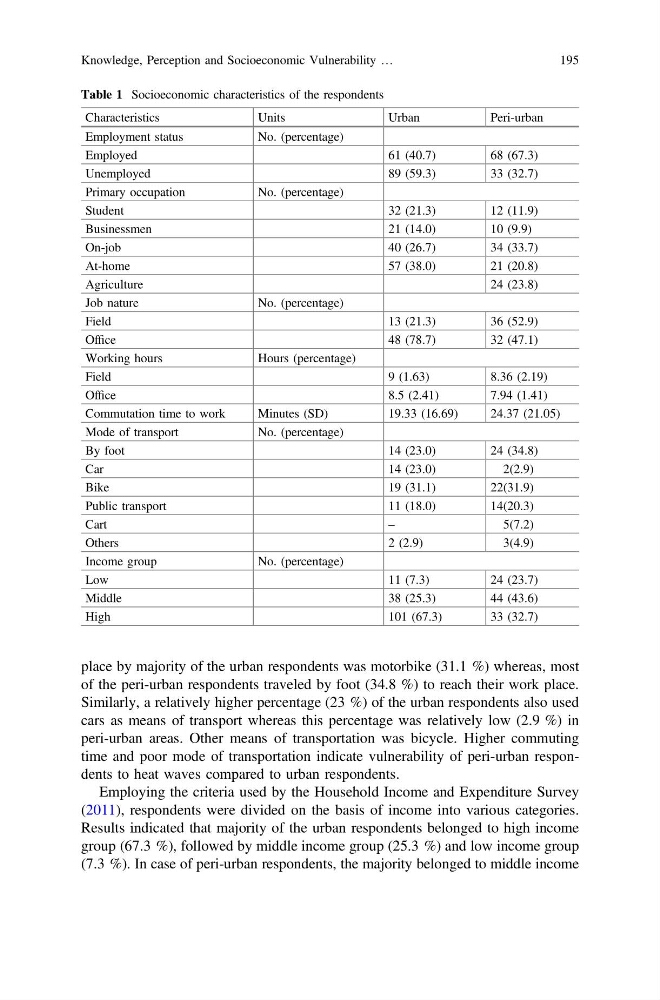
place by majority of the urban respondents was motorbike (31.1 %) whereas, most
of the peri-urban respondents traveled by foot (34.8 %) to reach their work place.
Similarly, a relatively higher percentage (23 %) of the urban respondents also used
cars as means of transport whereas this percentage was relatively low (2.9 %) in
peri-urban areas. Other means of transportation was bicycle. Higher commuting
time and poor mode of transportation indicate vulnerability of peri-urban respondents to heat waves compared to urban respondents.
Employing the criteria used by the Household Income and Expenditure Survey
(2011), respondents were divided on the basis of income into various categories.
Results indicated that majority of the urban respondents belonged to high income
group (67.3 %), followed by middle income group (25.3 %) and low income group
(7.3 %). In case of peri-urban respondents, the majority belonged to middle income
Table 1 Socioeconomic characteristics of the respondents
Characteristics
Units
Urban
Peri-urban
Employment status
No. (percentage)
Employed
61 (40.7)
68 (67.3)
Unemployed
89 (59.3)
33 (32.7)
Primary occupation
No. (percentage)
Student
32 (21.3)
12 (11.9)
Businessmen
21 (14.0)
10 (9.9)
On-job
40 (26.7)
34 (33.7)
At-home
57 (38.0)
21 (20.8)
Agriculture
24 (23.8)
Job nature
No. (percentage)
Field
13 (21.3)
36 (52.9)
Office
48 (78.7)
32 (47.1)
Working hours
Hours (percentage)
Field
9 (1.63)
8.36 (2.19)
Office
8.5 (2.41)
7.94 (1.41)
Commutation time to work
Minutes (SD)
19.33 (16.69)
24.37 (21.05)
Mode of transport
No. (percentage)
By foot
14 (23.0)
24 (34.8)
Car
14 (23.0)
2(2.9)
Bike
19 (31.1)
22(31.9)
Public transport
11 (18.0)
14(20.3)
Cart
–
5(7.2)
Others
2 (2.9)
3(4.9)
Income group
No. (percentage)
Low
11 (7.3)
24 (23.7)
Middle
38 (25.3)
44 (43.6)
High
101 (67.3)
33 (32.7)
Knowledge, Perception and Socioeconomic Vulnerability …
195
of the peri-urban respondents traveled by foot (34.8 %) to reach their work place.
Similarly, a relatively higher percentage (23 %) of the urban respondents also used
cars as means of transport whereas this percentage was relatively low (2.9 %) in
peri-urban areas. Other means of transportation was bicycle. Higher commuting
time and poor mode of transportation indicate vulnerability of peri-urban respondents to heat waves compared to urban respondents.
Employing the criteria used by the Household Income and Expenditure Survey
(2011), respondents were divided on the basis of income into various categories.
Results indicated that majority of the urban respondents belonged to high income
group (67.3 %), followed by middle income group (25.3 %) and low income group
(7.3 %). In case of peri-urban respondents, the majority belonged to middle income
Table 1 Socioeconomic characteristics of the respondents
Characteristics
Units
Urban
Peri-urban
Employment status
No. (percentage)
Employed
61 (40.7)
68 (67.3)
Unemployed
89 (59.3)
33 (32.7)
Primary occupation
No. (percentage)
Student
32 (21.3)
12 (11.9)
Businessmen
21 (14.0)
10 (9.9)
On-job
40 (26.7)
34 (33.7)
At-home
57 (38.0)
21 (20.8)
Agriculture
24 (23.8)
Job nature
No. (percentage)
Field
13 (21.3)
36 (52.9)
Office
48 (78.7)
32 (47.1)
Working hours
Hours (percentage)
Field
9 (1.63)
8.36 (2.19)
Office
8.5 (2.41)
7.94 (1.41)
Commutation time to work
Minutes (SD)
19.33 (16.69)
24.37 (21.05)
Mode of transport
No. (percentage)
By foot
14 (23.0)
24 (34.8)
Car
14 (23.0)
2(2.9)
Bike
19 (31.1)
22(31.9)
Public transport
11 (18.0)
14(20.3)
Cart
–
5(7.2)
Others
2 (2.9)
3(4.9)
Income group
No. (percentage)
Low
11 (7.3)
24 (23.7)
Middle
38 (25.3)
44 (43.6)
High
101 (67.3)
33 (32.7)
Knowledge, Perception and Socioeconomic Vulnerability …
195