

the number of persons having income source is less. The district of Bidar has
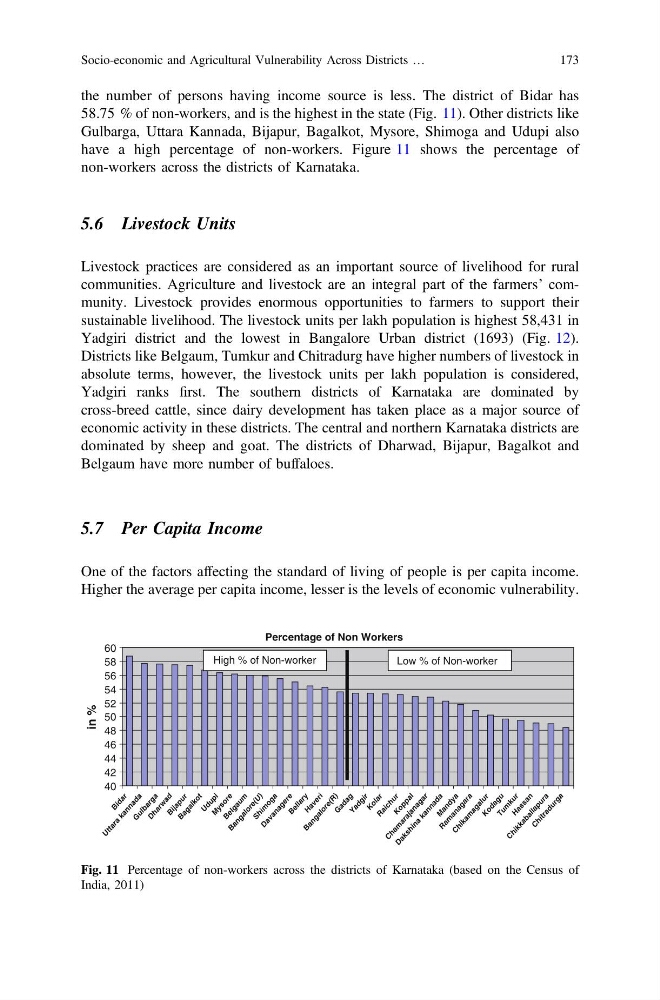
58.75 % of non-workers, and is the highest in the state (Fig. 11). Other districts like
Gulbarga, Uttara Kannada, Bijapur, Bagalkot, Mysore, Shimoga and Udupi also
have a high percentage of non-workers. Figure 11 shows the percentage of
non-workers across the districts of Karnataka.
5.6 Livestock Units
Livestock practices are considered as an important source of livelihood for rural
communities. Agriculture and livestock are an integral part of the farmers’ community. Livestock provides enormous opportunities to farmers to support their
sustainable livelihood. The livestock units per lakh population is highest 58,431 in
Yadgiri district and the lowest in Bangalore Urban district (1693) (Fig. 12).
Districts like Belgaum, Tumkur and Chitradurg have higher numbers of livestock in
absolute terms, however, the livestock units per lakh population is considered,
Yadgiri ranks first. The southern districts of Karnataka are dominated by
cross-breed cattle, since dairy development has taken place as a major source of
economic activity in these districts. The central and northern Karnataka districts are
dominated by sheep and goat. The districts of Dharwad, Bijapur, Bagalkot and
Belgaum have more number of buffaloes.
5.7 Per Capita Income
One of the factors affecting the standard of living of people is per capita income.
Higher the average per capita income, lesser is the levels of economic vulnerability.
Percentage of Non Workers
40
42
44
46
48
50
52
54
56
58
60
B id
a r
U t t a r a
k a n n a d a
G
u lb
a r g a
D h a r w
a d
B ij a p u r
B a g a lk
o t
U d u p i
M
y s o r e
B e lg
a u m
B a n g a lo
r e ( U )
S h im
o g a
D a v a n a g e r e
B e ll a r y
H a v e r i
B a n g a lo
r e ( R )
G
a d a g
Y a d g ir
K o la
r
R a ic
h u r
K o p p a l
C h a m
a r a ja
n a g a r
D a k s h in
a
k a n n a d a
M
a n d y a
R a m
a n a g a r a
C h ik
a m
a g a lu
r
K o d a g u
T u m
k u r
H a s s a n
C h ik
k a b a ll a p u r a
C h it r a d u r g a
in %
High % of Non-worker
Low % of Non-worker
Fig. 11 Percentage of non-workers across the districts of Karnataka (based on the Census of
India, 2011)
Socio-economic and Agricultural Vulnerability Across Districts …
173
58.75 % of non-workers, and is the highest in the state (Fig. 11). Other districts like
Gulbarga, Uttara Kannada, Bijapur, Bagalkot, Mysore, Shimoga and Udupi also
have a high percentage of non-workers. Figure 11 shows the percentage of
non-workers across the districts of Karnataka.
5.6 Livestock Units
Livestock practices are considered as an important source of livelihood for rural
communities. Agriculture and livestock are an integral part of the farmers’ community. Livestock provides enormous opportunities to farmers to support their
sustainable livelihood. The livestock units per lakh population is highest 58,431 in
Yadgiri district and the lowest in Bangalore Urban district (1693) (Fig. 12).
Districts like Belgaum, Tumkur and Chitradurg have higher numbers of livestock in
absolute terms, however, the livestock units per lakh population is considered,
Yadgiri ranks first. The southern districts of Karnataka are dominated by
cross-breed cattle, since dairy development has taken place as a major source of
economic activity in these districts. The central and northern Karnataka districts are
dominated by sheep and goat. The districts of Dharwad, Bijapur, Bagalkot and
Belgaum have more number of buffaloes.
5.7 Per Capita Income
One of the factors affecting the standard of living of people is per capita income.
Higher the average per capita income, lesser is the levels of economic vulnerability.
Percentage of Non Workers
40
42
44
46
48
50
52
54
56
58
60
B id
a r
U t t a r a
k a n n a d a
G
u lb
a r g a
D h a r w
a d
B ij a p u r
B a g a lk
o t
U d u p i
M
y s o r e
B e lg
a u m
B a n g a lo
r e ( U )
S h im
o g a
D a v a n a g e r e
B e ll a r y
H a v e r i
B a n g a lo
r e ( R )
G
a d a g
Y a d g ir
K o la
r
R a ic
h u r
K o p p a l
C h a m
a r a ja
n a g a r
D a k s h in
a
k a n n a d a
M
a n d y a
R a m
a n a g a r a
C h ik
a m
a g a lu
r
K o d a g u
T u m
k u r
H a s s a n
C h ik
k a b a ll a p u r a
C h it r a d u r g a
in %
High % of Non-worker
Low % of Non-worker
Fig. 11 Percentage of non-workers across the districts of Karnataka (based on the Census of
India, 2011)
Socio-economic and Agricultural Vulnerability Across Districts …
173