

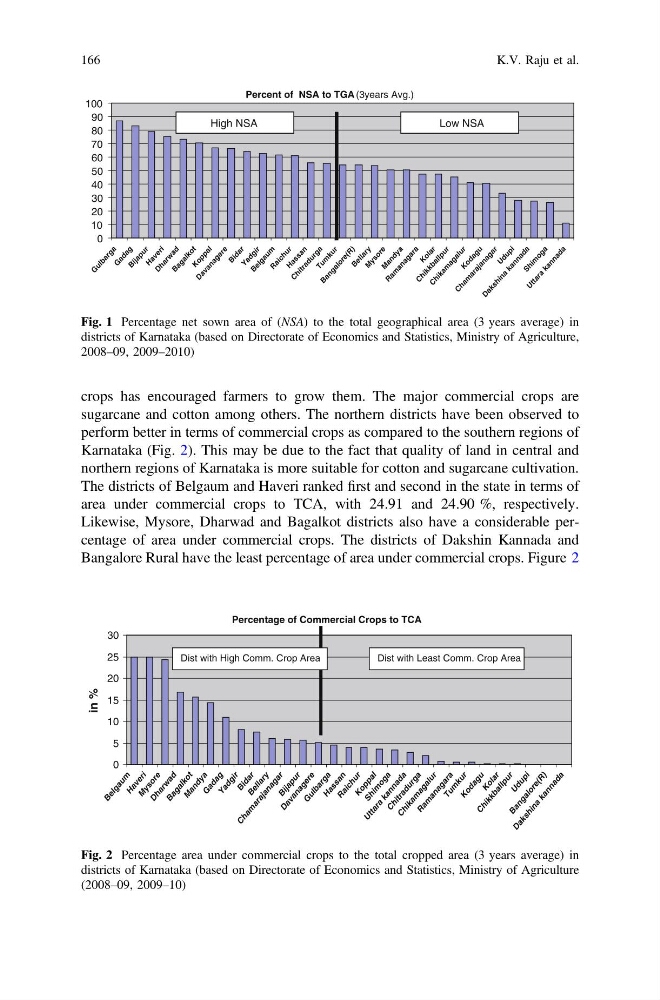
crops has encouraged farmers to grow them. The major commercial crops are
sugarcane and cotton among others. The northern districts have been observed to
perform better in terms of commercial crops as compared to the southern regions of
Karnataka (Fig. 2). This may be due to the fact that quality of land in central and
northern regions of Karnataka is more suitable for cotton and sugarcane cultivation.
The districts of Belgaum and Haveri ranked first and second in the state in terms of
area under commercial crops to TCA, with 24.91 and 24.90 %, respectively.
Likewise, Mysore, Dharwad and Bagalkot districts also have a considerable percentage of area under commercial crops. The districts of Dakshin Kannada and
Bangalore Rural have the least percentage of area under commercial crops. Figure 2
Percent of NSA to TGA (3years Avg.)
0
10
20
30
40
50
60
70
80
90
100
G
u lb
a r g a
G
a d a g
B ij a p u r
H a v e r i
D h a r w
a d
B a g a lk
o t
K o p p a l
D a v a n a g e r e
B id
a r
Y a d g ir
B e lg
a u m R a ic
h u r
H a s s a n
C h it r a d u r g a
T u m
k u r
B a n g a lo
r e ( R ) B e ll a r y
M
y s o r e M
a n d y a
R a m
a n a g a r a K o la
r
C h ik
k b a ll p u r
C h ik
a m
a g a lu
r
K o d a g u
C h a m
a r a ja
n a g a r
U d u p i
D a k s h in
a
k a n n a d a
S h im
o g a
U t t a r a
k a n n a d a
High NSA
Low NSA
Fig. 1 Percentage net sown area of (NSA) to the total geographical area (3 years average) in
districts of Karnataka (based on Directorate of Economics and Statistics, Ministry of Agriculture,
2008–09, 2009–2010)
Percentage of Commercial Crops to TCA
0
5
10
15
20
25
30
B e l g a u m
H a v e r i
M
y s o r e
D h a r w
a d
B a g a l k o t
M
a n d y a
G
a d a g
Y a d g i r
B i d a r
B e l l a r y
C h a m
a r a j a n a g a r
B i j a p u r
D a v a n a g e r e
G
u l b a r g a
H a s s a n
R a i c h u r
K o p p a l
S h i m
o g a
U t t a r a
k a n n a d a
C h i t r a d u r g a
C h i k a m
a g a l u r
R a m
a n a g a r a
T u m
k u r
K o d a g u
K o l a r
C h i k k b a l l p u r
U d u p i
B a n g a l o r e ( R )
D a k s h i n a
k a n n a d a
in %
Dist with High Comm. Crop Area
Dist with Least Comm. Crop Area
Fig. 2 Percentage area under commercial crops to the total cropped area (3 years average) in
districts of Karnataka (based on Directorate of Economics and Statistics, Ministry of Agriculture
(2008–09, 2009–10)
166
K.V. Raju et al.
sugarcane and cotton among others. The northern districts have been observed to
perform better in terms of commercial crops as compared to the southern regions of
Karnataka (Fig. 2). This may be due to the fact that quality of land in central and
northern regions of Karnataka is more suitable for cotton and sugarcane cultivation.
The districts of Belgaum and Haveri ranked first and second in the state in terms of
area under commercial crops to TCA, with 24.91 and 24.90 %, respectively.
Likewise, Mysore, Dharwad and Bagalkot districts also have a considerable percentage of area under commercial crops. The districts of Dakshin Kannada and
Bangalore Rural have the least percentage of area under commercial crops. Figure 2
Percent of NSA to TGA (3years Avg.)
0
10
20
30
40
50
60
70
80
90
100
G
u lb
a r g a
G
a d a g
B ij a p u r
H a v e r i
D h a r w
a d
B a g a lk
o t
K o p p a l
D a v a n a g e r e
B id
a r
Y a d g ir
B e lg
a u m R a ic
h u r
H a s s a n
C h it r a d u r g a
T u m
k u r
B a n g a lo
r e ( R ) B e ll a r y
M
y s o r e M
a n d y a
R a m
a n a g a r a K o la
r
C h ik
k b a ll p u r
C h ik
a m
a g a lu
r
K o d a g u
C h a m
a r a ja
n a g a r
U d u p i
D a k s h in
a
k a n n a d a
S h im
o g a
U t t a r a
k a n n a d a
High NSA
Low NSA
Fig. 1 Percentage net sown area of (NSA) to the total geographical area (3 years average) in
districts of Karnataka (based on Directorate of Economics and Statistics, Ministry of Agriculture,
2008–09, 2009–2010)
Percentage of Commercial Crops to TCA
0
5
10
15
20
25
30
B e l g a u m
H a v e r i
M
y s o r e
D h a r w
a d
B a g a l k o t
M
a n d y a
G
a d a g
Y a d g i r
B i d a r
B e l l a r y
C h a m
a r a j a n a g a r
B i j a p u r
D a v a n a g e r e
G
u l b a r g a
H a s s a n
R a i c h u r
K o p p a l
S h i m
o g a
U t t a r a
k a n n a d a
C h i t r a d u r g a
C h i k a m
a g a l u r
R a m
a n a g a r a
T u m
k u r
K o d a g u
K o l a r
C h i k k b a l l p u r
U d u p i
B a n g a l o r e ( R )
D a k s h i n a
k a n n a d a
in %
Dist with High Comm. Crop Area
Dist with Least Comm. Crop Area
Fig. 2 Percentage area under commercial crops to the total cropped area (3 years average) in
districts of Karnataka (based on Directorate of Economics and Statistics, Ministry of Agriculture
(2008–09, 2009–10)
166
K.V. Raju et al.