

Climate, Climate Variability and Impacts in the Mediterranean Area: An Overview
49
from which aerosols build up by chemical reactions.
0' Almeida (1986) studied the Saharian dust load near its source in Agadez
(Niger) and found mass concentrations of mineral dust varying between 40 jlg m,3
under clear sky conditions up to 9300 jlg m,3 during severe sand storms. This is a
very high load as compared to global average background concentrations of7jlg m,3
(Heintzenberg, 1980) and sea salt mass concentrations of 100 jlg m,3 for a wind
speed at 20 m/s (Lovett, 1978). Towards Europe the annual mass transport from the
source region primarily between Air and Tamanrasset was estimated to be 8 * 10 7
tin 1981 and 12 * 10 7 t in 1982. The optical aerosol depth at 500 nm over Assekrem
(2730 m, southern Algeria), as an example, varied in 198112 between 0.04 in winter
and 0.8 during several months in summer (0' Almeida, 1987).
The optical properties of Saharan aerosol was investigated in 1980 (Fouquart et
al. 1987a and b). During this 17 days lasting experiment (ECLATS) the optical
depth at 520 nm even rose up to 1.4 while minimum values were 0.2. The single
scattering albedo of the particles was estimated to be 0.95 and the asymmetry factor
about 0.65 in the shortwave domain. The ratio of thermal infrared (8-14 jlm) to
visible (0.55 jlm) optical depths were found to be close to 0.1. Calculations of the
heating rate resulted in an additional shortwave heating between 0.7 K day'!
averaged over the most clear days and 1.8 K day'! for the dustiest day. The infrared
cooling is smaller, 0.2 K day'! and 1 K day-! respectively. The net effect of the desert
... ......
0.8
I
:x
I0.. 0.6
w
0
X
...J
c(
...
U O.
~
0..
0
600
AEROSOL & RAYLEIGH OPTICAL OEPTH
Niger, Italy, Spain; clear & duststorm
...
...
:x ...
...
:x
800
1000
1200
1400
WAVELENGTH (nm)
- - ...
- _ ...
t2l'1OII'I
•
CIlOUO
...
...,. .
...
RoI
...
.......
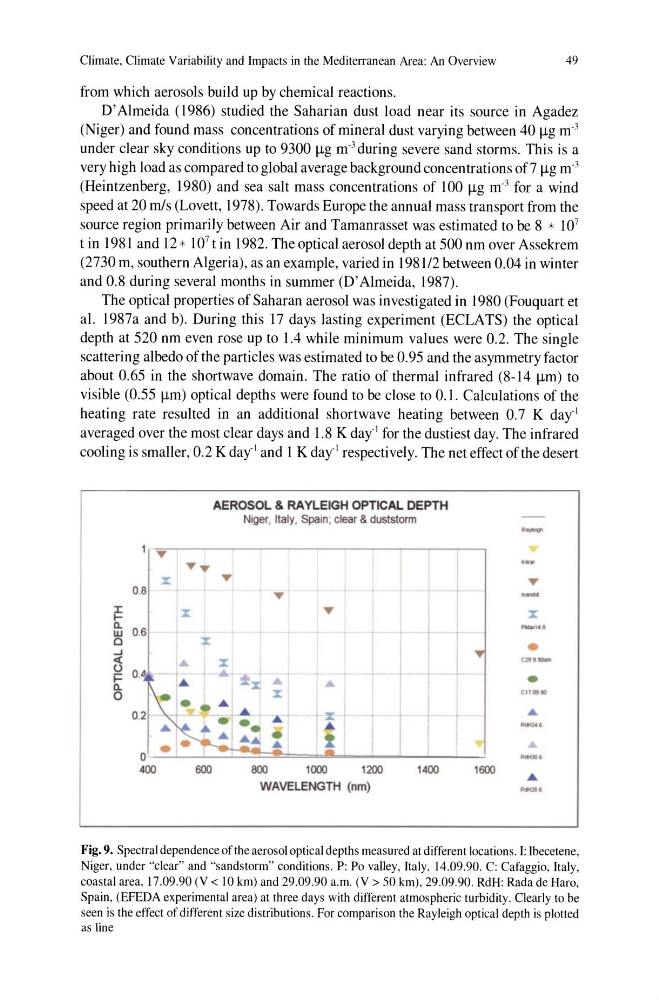
Fig. 9. Spectral dependence of the aerosol optical depths measured at different locations. I: Ibecetene,
Niger, under "clear" and "sandstorm" conditions. P: Po valley, Italy, 14.09.90. C: Cafaggio, Italy,
coastal area, 17.09.90 (V < 10 km) and 29.09.90 a.m. (V> 50 km) , 29.09.90. RdH : Rada de Haro,
Spain, (EFEDA experimental area) at three days with different atmospheric turbidity. Clearly to be
seen is the effect of different size distributions. For comparison the Rayleigh optical depth is plotted
as line
49
from which aerosols build up by chemical reactions.
0' Almeida (1986) studied the Saharian dust load near its source in Agadez
(Niger) and found mass concentrations of mineral dust varying between 40 jlg m,3
under clear sky conditions up to 9300 jlg m,3 during severe sand storms. This is a
very high load as compared to global average background concentrations of7jlg m,3
(Heintzenberg, 1980) and sea salt mass concentrations of 100 jlg m,3 for a wind
speed at 20 m/s (Lovett, 1978). Towards Europe the annual mass transport from the
source region primarily between Air and Tamanrasset was estimated to be 8 * 10 7
tin 1981 and 12 * 10 7 t in 1982. The optical aerosol depth at 500 nm over Assekrem
(2730 m, southern Algeria), as an example, varied in 198112 between 0.04 in winter
and 0.8 during several months in summer (0' Almeida, 1987).
The optical properties of Saharan aerosol was investigated in 1980 (Fouquart et
al. 1987a and b). During this 17 days lasting experiment (ECLATS) the optical
depth at 520 nm even rose up to 1.4 while minimum values were 0.2. The single
scattering albedo of the particles was estimated to be 0.95 and the asymmetry factor
about 0.65 in the shortwave domain. The ratio of thermal infrared (8-14 jlm) to
visible (0.55 jlm) optical depths were found to be close to 0.1. Calculations of the
heating rate resulted in an additional shortwave heating between 0.7 K day'!
averaged over the most clear days and 1.8 K day'! for the dustiest day. The infrared
cooling is smaller, 0.2 K day'! and 1 K day-! respectively. The net effect of the desert
... ......
0.8
I
:x
I0.. 0.6
w
0
X
...J
c(
...
U O.
~
0..
0
600
AEROSOL & RAYLEIGH OPTICAL OEPTH
Niger, Italy, Spain; clear & duststorm
...
...
:x ...
...
:x
800
1000
1200
1400
WAVELENGTH (nm)
- - ...
- _ ...
t2l'1OII'I
•
CIlOUO
...
...,. .
...
RoI
...
.......
Fig. 9. Spectral dependence of the aerosol optical depths measured at different locations. I: Ibecetene,
Niger, under "clear" and "sandstorm" conditions. P: Po valley, Italy, 14.09.90. C: Cafaggio, Italy,
coastal area, 17.09.90 (V < 10 km) and 29.09.90 a.m. (V> 50 km) , 29.09.90. RdH : Rada de Haro,
Spain, (EFEDA experimental area) at three days with different atmospheric turbidity. Clearly to be
seen is the effect of different size distributions. For comparison the Rayleigh optical depth is plotted
as line