

40
H.-J. Bolle
SST was in the average low between 1975 and 1985 and high between 1960 and
1970 as well as between 1987 and 1997. No trend is recognized in these data since
1988.
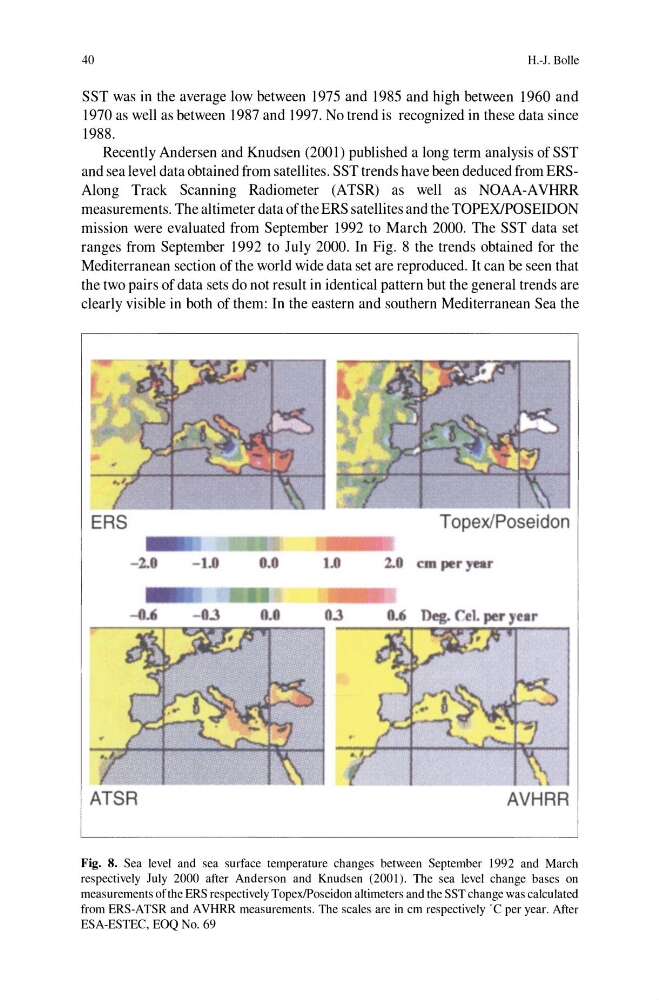
Recently Andersen and Knudsen (2001) published a long term analysis of SST
and sea level data obtained from satellites. SST trends have been deduced from ERSAlong Track Scanning Radiometer (ATSR) as well as NOAA-AVHRR
measurements. The altimeter data ofthe ERS satellites and the TOPEXIPOSEIDON
mission were evaluated from September 1992 to March 2000. The SST data set
ranges from September 1992 to July 2000. In Fig. 8 the trends obtained for the
Mediterranean section of the world wide data set are reproduced. It can be seen that
the two pairs of data sets do not result in identical pattern but the general trends are
clearly visible in both of them: In the eastern and southern Mediterranean Sea the
ERS
T opexiPoseidon
1.0
2.0 em per year
ATSR
AVHRR
Fig. 8. Sea level and sea surface temperature changes between September 1992 and March
respectively July 2000 after Anderson and Knudsen (2001). The sea level change bases on
measurements of the ERS respectively TopexlPoseidon altimeters and the SST change was calculated
from ERS-ATSR and AVHRR measurements. The scales are in cm respectively °C per year. After
ESA-ESTEC, EOQ No. 69
H.-J. Bolle
SST was in the average low between 1975 and 1985 and high between 1960 and
1970 as well as between 1987 and 1997. No trend is recognized in these data since
1988.
Recently Andersen and Knudsen (2001) published a long term analysis of SST
and sea level data obtained from satellites. SST trends have been deduced from ERSAlong Track Scanning Radiometer (ATSR) as well as NOAA-AVHRR
measurements. The altimeter data ofthe ERS satellites and the TOPEXIPOSEIDON
mission were evaluated from September 1992 to March 2000. The SST data set
ranges from September 1992 to July 2000. In Fig. 8 the trends obtained for the
Mediterranean section of the world wide data set are reproduced. It can be seen that
the two pairs of data sets do not result in identical pattern but the general trends are
clearly visible in both of them: In the eastern and southern Mediterranean Sea the
ERS
T opexiPoseidon
1.0
2.0 em per year
ATSR
AVHRR
Fig. 8. Sea level and sea surface temperature changes between September 1992 and March
respectively July 2000 after Anderson and Knudsen (2001). The sea level change bases on
measurements of the ERS respectively TopexlPoseidon altimeters and the SST change was calculated
from ERS-ATSR and AVHRR measurements. The scales are in cm respectively °C per year. After
ESA-ESTEC, EOQ No. 69