

26
H.-J. Bolle
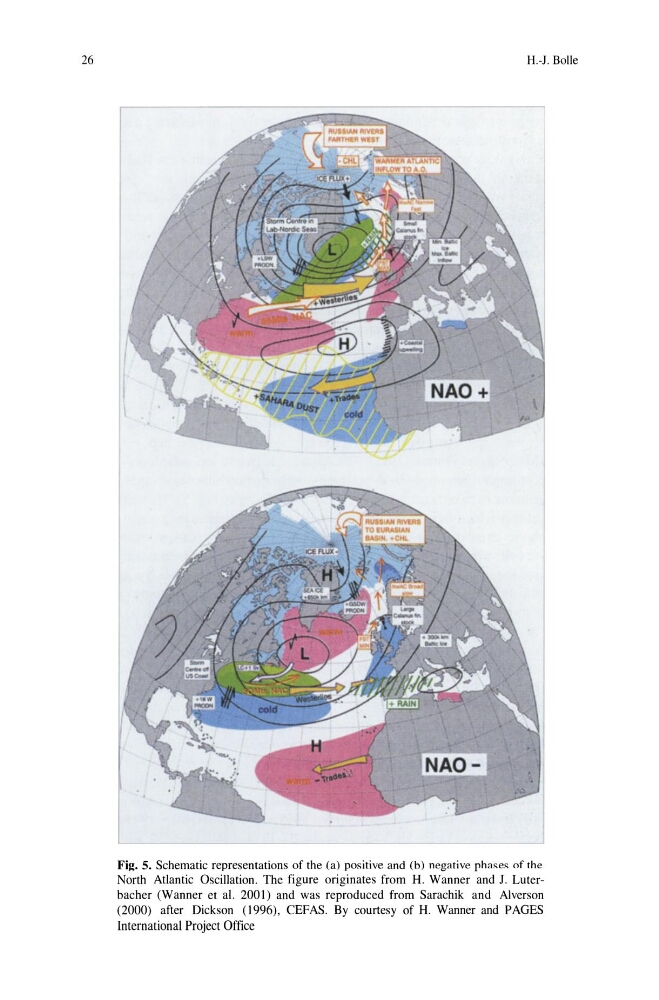
Fig. 5. Schematic representations of the (a) positive and (b) negative phases of the
North Atlantic Oscillation. The figure originates from H. Wanner and J. Luterbacher (Wanner et al. 2001) and was reproduced from Sarachik and Alverson
(2000) after Dickson (1996), CEFAS. By courtesy of H. Wanner and PAGES
International Project Office
H.-J. Bolle
Fig. 5. Schematic representations of the (a) positive and (b) negative phases of the
North Atlantic Oscillation. The figure originates from H. Wanner and J. Luterbacher (Wanner et al. 2001) and was reproduced from Sarachik and Alverson
(2000) after Dickson (1996), CEFAS. By courtesy of H. Wanner and PAGES
International Project Office