

16
H.-J. Bolle
REFLECTANCE OF VEGETATIONI
0.6 .-------:::;; __ ........, __ -........,-----:-r--;------"
0.5
w
o 0.4
Z
«
I0.3
o
· W
---l
0.2
LL
W
a:::: 0.1
0·950 500 750 1000 1250 1500 1750 2000 2250 2500
WAVELENGTH (nm)
L Alfalfa - H. Oak Wheat - Olive - Bush Mat.
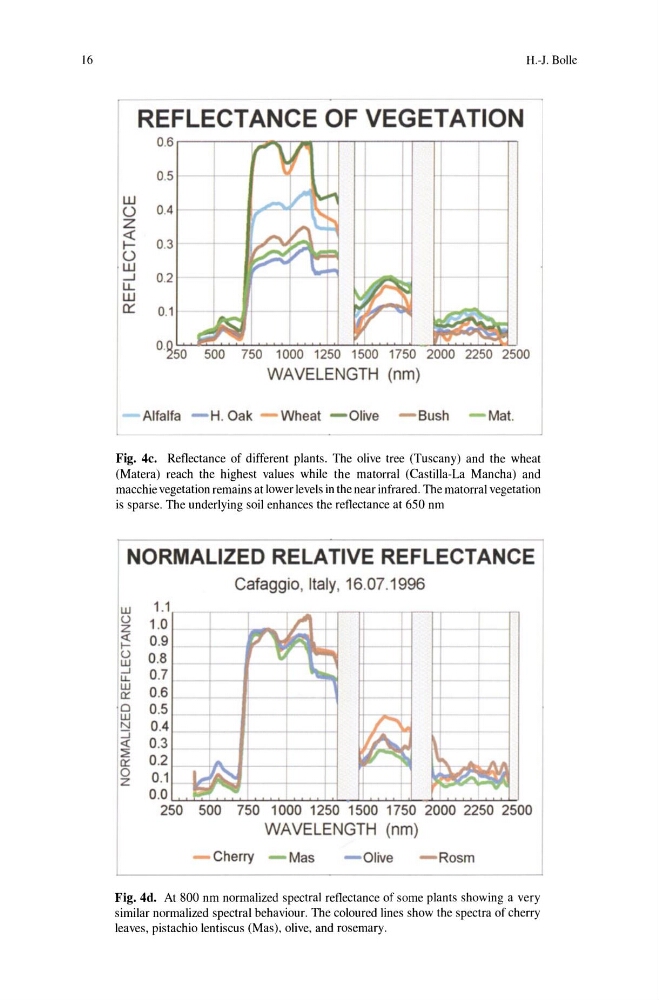
Fig. 4c. Reflectance of different plants. The olive tree (Tuscany) and the wheat
(Matera) reach the highest values while the matorral (Castilla-La Mancha) and
macchie vegetation remains at lower levels in the near infrared. The matorral vegetation
is sparse. The underlying soil enhances the reflectance at 650 nm
I NORMALIZED RELATIVE REFLECTANCEl
Cafaggio, Italy, 16.07.1996
w
o
z
~
o
W
...J
LL
W
c:::
I ~
::J
«
~
c:::
o z
L
1.1
1.0
0.9
0.8
0.7
0.6
0.5
0.4
0.3
0.2
0 .1
O . O ~~~~~~~~~-L~~~~~~~~
250 500 750 1000 1250 1500 1750 2000 2250 2500
WAVELENGTH (nm)
Cherry - Mas
- Olive
- Rosm
Fig. 4d. At 800 nm normalized spectral reflectance of some plants showing a very
similar normalized spectral behaviour. The coloured lines show the spectra of cherry
leaves, pistachio lentiscus (Mas), olive, and rosemary.
H.-J. Bolle
REFLECTANCE OF VEGETATIONI
0.6 .-------:::;; __ ........, __ -........,-----:-r--;------"
0.5
w
o 0.4
Z
«
I0.3
o
· W
---l
0.2
LL
W
a:::: 0.1
0·950 500 750 1000 1250 1500 1750 2000 2250 2500
WAVELENGTH (nm)
L Alfalfa - H. Oak Wheat - Olive - Bush Mat.
Fig. 4c. Reflectance of different plants. The olive tree (Tuscany) and the wheat
(Matera) reach the highest values while the matorral (Castilla-La Mancha) and
macchie vegetation remains at lower levels in the near infrared. The matorral vegetation
is sparse. The underlying soil enhances the reflectance at 650 nm
I NORMALIZED RELATIVE REFLECTANCEl
Cafaggio, Italy, 16.07.1996
w
o
z
~
o
W
...J
LL
W
c:::
I ~
::J
«
~
c:::
o z
L
1.1
1.0
0.9
0.8
0.7
0.6
0.5
0.4
0.3
0.2
0 .1
O . O ~~~~~~~~~-L~~~~~~~~
250 500 750 1000 1250 1500 1750 2000 2250 2500
WAVELENGTH (nm)
Cherry - Mas
- Olive
- Rosm
Fig. 4d. At 800 nm normalized spectral reflectance of some plants showing a very
similar normalized spectral behaviour. The coloured lines show the spectra of cherry
leaves, pistachio lentiscus (Mas), olive, and rosemary.