

Climate, Climate Variability and Impacts in the Mediterranean Area: An Overview
9
between 90 and zero mmlmonth with a total of 424 mmlyear. The temperature range
is only 6.TC. The respective numbers are in the slightly further northern Naples
(40.5 N) 9'C to 25'C (a range of 16'C), 122 - 15.2 mm/month, 860 mmlyear, and
in the slightly more southern Benghasi (32' N) 13 - 26C (a range of 13C), 94 - 0
mmlmonth, and 302 mmlyear (Strahler, 1975).
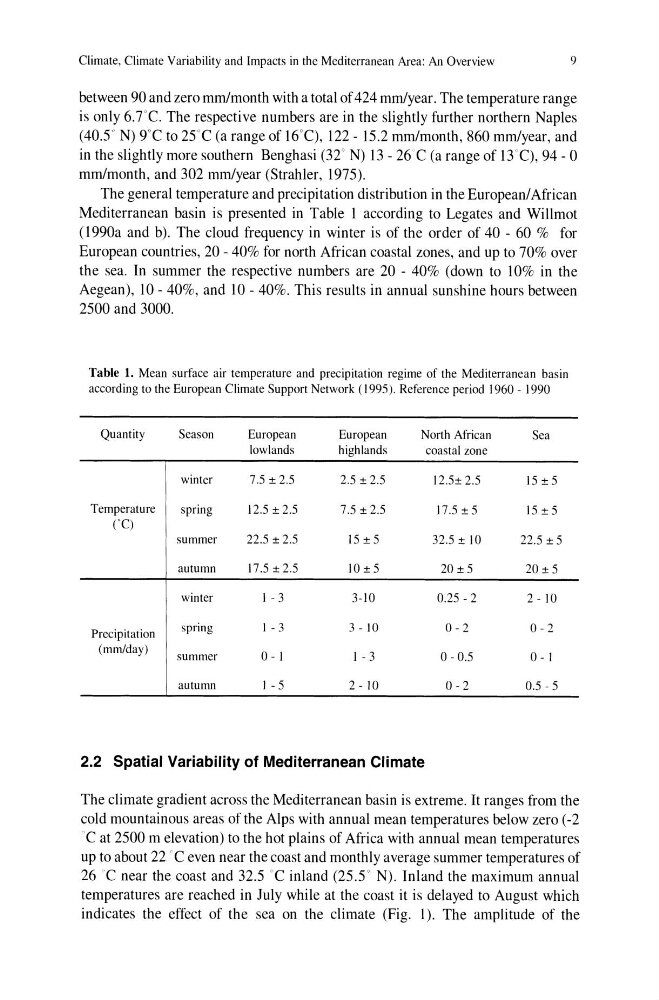
The general temperature and precipitation distribution in the European/African
Mediterranean basin is presented in Table 1 according to Legates and Willmot
(l990a and b). The cloud frequency in winter is of the order of 40 - 60 % for
European countries, 20 - 40% for north African coastal zones, and up to 70% over
the sea. In summer the respective numbers are 20 - 40% (down to lO% in the
Aegean), lO - 40%, and 10 - 40%. This results in annual sunshine hours between
2500 and 3000.
Table 1. Mean surface air temperature and precipitation regime of the Mediterranean basin
according to the European Climate Support Network (199S). Reference period 1960 - 1990
Quantity
Season
European
European
North African
Sea
lowlands
highlands
coastal zone
winter
7.S ± 2.S
2.S ± 2.S
12.S± 2.S
15 ± 5
Temperature
spring
12.5 ± 2.S
7.5 ± 2.5
17.5 ± 5
15 ± 5
CC)
summer
22.S ± 2.5
IS ± S
32.S ± 10
22.S ± S
autumn
17.S±2.5
10 ± 5
20 ± 5
20 ± 5
winter
I - 3
3-10
0.25 - 2
2 - 10
Precipitation
spring
I - 3
3 - 10
0-2
0-2
(mm/day)
summer
0-1
1 - 3
0- O.S
0- I
autumn
I - 5
2 - 10
0-2
0.5 - 5
2.2 Spatial Variability of Mediterranean Climate
The climate gradient across the Mediterranean basin is extreme. It ranges from the
cold mountainous areas of the Alps with annual mean temperatures below zero (-2
Cat 2500 m elevation) to the hot plains of Africa with annual mean temperatures
up to about 22 cC even near the coast and monthly average summer temperatures of
26'C near the coast and 32.5C inland (255 N). Inland the maximum annual
temperatures are reached in July while at the coast it is delayed to August which
indicates the effect of the sea on the climate (Fig. I). The amplitude of the
9
between 90 and zero mmlmonth with a total of 424 mmlyear. The temperature range
is only 6.TC. The respective numbers are in the slightly further northern Naples
(40.5 N) 9'C to 25'C (a range of 16'C), 122 - 15.2 mm/month, 860 mmlyear, and
in the slightly more southern Benghasi (32' N) 13 - 26C (a range of 13C), 94 - 0
mmlmonth, and 302 mmlyear (Strahler, 1975).
The general temperature and precipitation distribution in the European/African
Mediterranean basin is presented in Table 1 according to Legates and Willmot
(l990a and b). The cloud frequency in winter is of the order of 40 - 60 % for
European countries, 20 - 40% for north African coastal zones, and up to 70% over
the sea. In summer the respective numbers are 20 - 40% (down to lO% in the
Aegean), lO - 40%, and 10 - 40%. This results in annual sunshine hours between
2500 and 3000.
Table 1. Mean surface air temperature and precipitation regime of the Mediterranean basin
according to the European Climate Support Network (199S). Reference period 1960 - 1990
Quantity
Season
European
European
North African
Sea
lowlands
highlands
coastal zone
winter
7.S ± 2.S
2.S ± 2.S
12.S± 2.S
15 ± 5
Temperature
spring
12.5 ± 2.S
7.5 ± 2.5
17.5 ± 5
15 ± 5
CC)
summer
22.S ± 2.5
IS ± S
32.S ± 10
22.S ± S
autumn
17.S±2.5
10 ± 5
20 ± 5
20 ± 5
winter
I - 3
3-10
0.25 - 2
2 - 10
Precipitation
spring
I - 3
3 - 10
0-2
0-2
(mm/day)
summer
0-1
1 - 3
0- O.S
0- I
autumn
I - 5
2 - 10
0-2
0.5 - 5
2.2 Spatial Variability of Mediterranean Climate
The climate gradient across the Mediterranean basin is extreme. It ranges from the
cold mountainous areas of the Alps with annual mean temperatures below zero (-2
Cat 2500 m elevation) to the hot plains of Africa with annual mean temperatures
up to about 22 cC even near the coast and monthly average summer temperatures of
26'C near the coast and 32.5C inland (255 N). Inland the maximum annual
temperatures are reached in July while at the coast it is delayed to August which
indicates the effect of the sea on the climate (Fig. I). The amplitude of the