

Temperature and Precipitation Variability and Trends in Northern Spain
261
- - - - - - - - - - - - - - - - - - - - - - - - - - - - - - - - - - - - - - - - - - - - - - - - - - - - - - - - - - - - - ,
41.5
w
g ,0.0
r~
35.5
37.0
o
aJ
U
o
u
-4.5
-3.0
-1.5
0.0
1.5
.j.0
FRANCE
SIJ!l , ,
Rel09so
Vi\°rlP PurnR,fOllc
43,0
Gfonpda
Mol (I
G:,
SQM
~
~ PAl ~oo,,,, bt~a",
/
41.5
CO'I" :}vo,,:;i
~~"
10.0
MV
MUfti!:!
o
;.
Mediterranean
Sea
38.5
37.0
35·~tO:-::.5...L--L1 ~_,'-::-~.O-'---'--:_7'-::-.5--'--'--:-~6.0-L--'----L4.5--L-'---..L3.0-'--'---..L,.5--"--~~·~t -L-' -'-1.5--'--'----'-1.0--'--'-,...i... 5
.-J 35.5
LONGITUDE
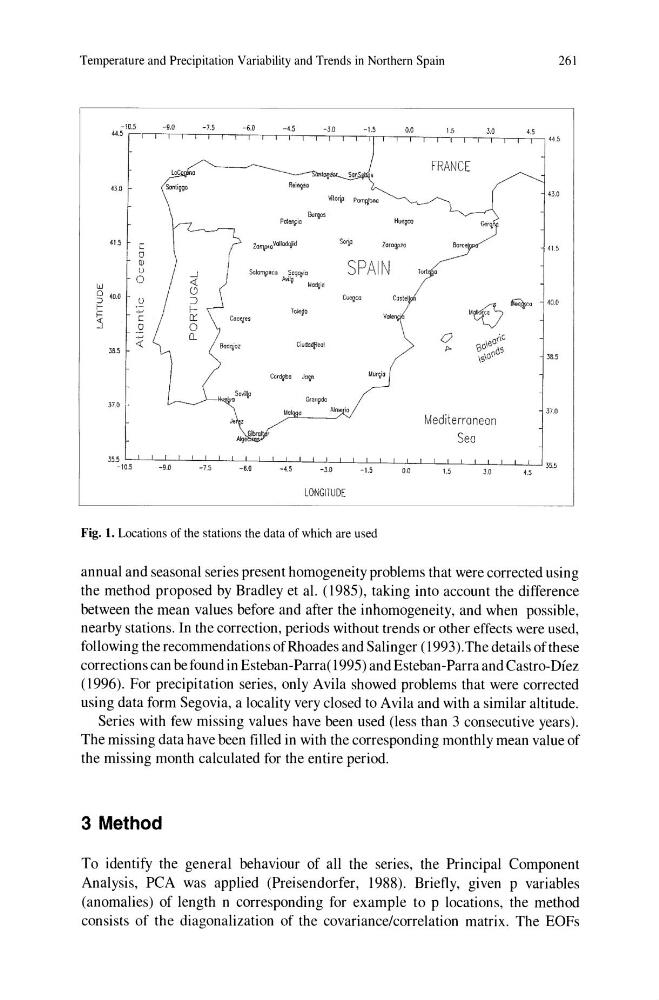
Fig. 1. Locations of the stations the data of which are used
annual and seasonal series present homogeneity problems that were corrected using
the method proposed by Bradley et al. (1985), taking into account the difference
between the mean values before and after the inhomogeneity, and when possible,
nearby stations. In the correction, periods without trends or other effects were used.
following the recommendations of Rhoades and Salinger (1993). The details of these
corrections can be found in Esteban -Parra( 1995) and Esteban -Parra and Castro-Dfez
(1996). For precipitation series, only Avila showed problems that were corrected
using data form Segovia, a locality very closed to A vila and with a similar altitude.
Series with few missing values have been used (less than 3 consecutive years).
The missing data have been filled in with the corresponding monthly mean value of
the missing month calculated for the entire period.
3 Method
To identify the general behaviour of all the series, the Principal Component
Analysis, PCA was applied (Preisendorfer, 1988). Briefly, given p variables
(anomalies) of length n corresponding for example to p locations, the method
consists of the diagonalization of the covariance/correlation matrix. The EOFs
261
- - - - - - - - - - - - - - - - - - - - - - - - - - - - - - - - - - - - - - - - - - - - - - - - - - - - - - - - - - - - - ,
41.5
w
g ,0.0
r~
35.5
37.0
o
aJ
U
o
u
-4.5
-3.0
-1.5
0.0
1.5
.j.0
FRANCE
SIJ!l , ,
Rel09so
Vi\°rlP PurnR,fOllc
43,0
Gfonpda
Mol (I
G:,
SQM
~
~ PAl ~oo,,,, bt~a",
/
41.5
CO'I" :}vo,,:;i
~~"
10.0
MV
MUfti!:!
o
;.
Mediterranean
Sea
38.5
37.0
35·~tO:-::.5...L--L1 ~_,'-::-~.O-'---'--:_7'-::-.5--'--'--:-~6.0-L--'----L4.5--L-'---..L3.0-'--'---..L,.5--"--~~·~t -L-' -'-1.5--'--'----'-1.0--'--'-,...i... 5
.-J 35.5
LONGITUDE
Fig. 1. Locations of the stations the data of which are used
annual and seasonal series present homogeneity problems that were corrected using
the method proposed by Bradley et al. (1985), taking into account the difference
between the mean values before and after the inhomogeneity, and when possible,
nearby stations. In the correction, periods without trends or other effects were used.
following the recommendations of Rhoades and Salinger (1993). The details of these
corrections can be found in Esteban -Parra( 1995) and Esteban -Parra and Castro-Dfez
(1996). For precipitation series, only Avila showed problems that were corrected
using data form Segovia, a locality very closed to A vila and with a similar altitude.
Series with few missing values have been used (less than 3 consecutive years).
The missing data have been filled in with the corresponding monthly mean value of
the missing month calculated for the entire period.
3 Method
To identify the general behaviour of all the series, the Principal Component
Analysis, PCA was applied (Preisendorfer, 1988). Briefly, given p variables
(anomalies) of length n corresponding for example to p locations, the method
consists of the diagonalization of the covariance/correlation matrix. The EOFs