

248
E. Piervitali, M. Colacino
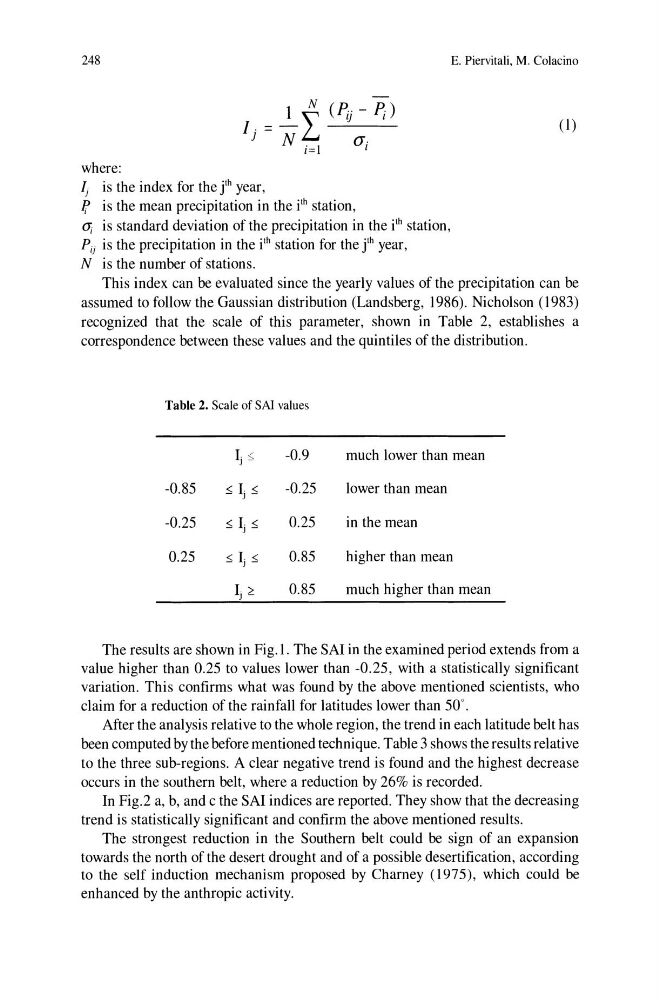
where:
1 f, (Pi) - ~)
I --L..
j - N i=l
(Ji
I j is the index for the fh year,
l! is the mean precipitation in the ilh station,
0; is standard deviation of the precipitation in the ilh station,
Pi) is the precipitation in the ilh station for the fh year,
N is the number of stations.
(1)
This index can be evaluated since the yearly values of the precipitation can be
assumed to follow the Gaussian distribution (Landsberg, 1986). Nicholson (1983)
recognized that the scale of this parameter, shown in Table 2, establishes a
correspondence between these values and the quintiles of the distribution.
Table 2. Scale of SAl values
I j S;
-0.9
much lower than mean
-0.85
~ I j ~
-0.25
lower than mean
-0.25
~ I j ~
0.25
in the mean
0.25
~ Ij ~
0.85
higher than mean
I j Z
0.85
much higher than mean
The results are shown in Fig.I. The SAl in the examined period extends from a
value higher than 0.25 to values lower than -0.25, with a statistically significant
variation. This confirms what was found by the above mentioned scientists, who
claim for a reduction of the rainfall for latitudes lower than 50".
After the analysis relative to the whole region, the trend in each latitude belt has
been computed by the before mentioned technique. Table 3 shows the results relative
to the three sub-regions. A clear negative trend is found and the highest decrease
occurs in the southern belt, where a reduction by 26% is recorded.
In Fig.2 a, b, and c the SAl indices are reported. They show that the decreasing
trend is statistically significant and confirm the above mentioned results.
The strongest reduction in the Southern belt could be sign of an expansion
towards the north of the desert drought and of a possible desertification, according
to the self induction mechanism proposed by Charney (1975), which could be
enhanced by the anthropic activity.
E. Piervitali, M. Colacino
where:
1 f, (Pi) - ~)
I --L..
j - N i=l
(Ji
I j is the index for the fh year,
l! is the mean precipitation in the ilh station,
0; is standard deviation of the precipitation in the ilh station,
Pi) is the precipitation in the ilh station for the fh year,
N is the number of stations.
(1)
This index can be evaluated since the yearly values of the precipitation can be
assumed to follow the Gaussian distribution (Landsberg, 1986). Nicholson (1983)
recognized that the scale of this parameter, shown in Table 2, establishes a
correspondence between these values and the quintiles of the distribution.
Table 2. Scale of SAl values
I j S;
-0.9
much lower than mean
-0.85
~ I j ~
-0.25
lower than mean
-0.25
~ I j ~
0.25
in the mean
0.25
~ Ij ~
0.85
higher than mean
I j Z
0.85
much higher than mean
The results are shown in Fig.I. The SAl in the examined period extends from a
value higher than 0.25 to values lower than -0.25, with a statistically significant
variation. This confirms what was found by the above mentioned scientists, who
claim for a reduction of the rainfall for latitudes lower than 50".
After the analysis relative to the whole region, the trend in each latitude belt has
been computed by the before mentioned technique. Table 3 shows the results relative
to the three sub-regions. A clear negative trend is found and the highest decrease
occurs in the southern belt, where a reduction by 26% is recorded.
In Fig.2 a, b, and c the SAl indices are reported. They show that the decreasing
trend is statistically significant and confirm the above mentioned results.
The strongest reduction in the Southern belt could be sign of an expansion
towards the north of the desert drought and of a possible desertification, according
to the self induction mechanism proposed by Charney (1975), which could be
enhanced by the anthropic activity.