

232
P. Maheras and C. Anagnostopoulou
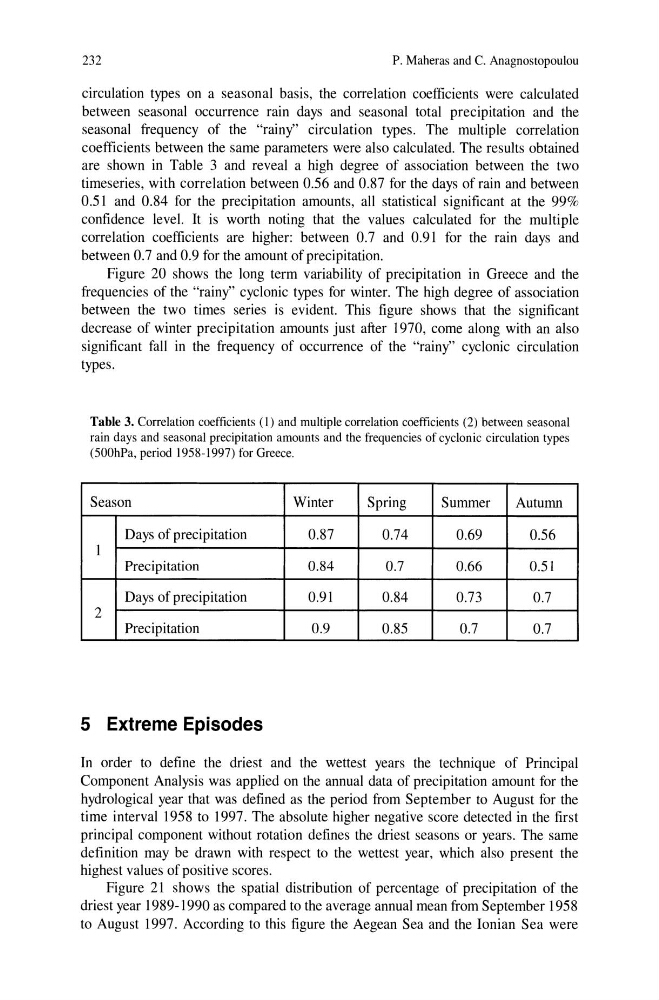
circulation types on a seasonal basis, the correlation coefficients were calculated
between seasonal occurrence rain days and seasonal total precipitation and the
seasonal frequency of the "rainy" circulation types. The multiple correlation
coefficients between the same parameters were also calculated. The results obtained
are shown in Table 3 and reveal a high degree of association between the two
timeseries, with correlation between 0.56 and 0.87 for the days of rain and between
0.51 and 0.84 for the precipitation amounts, all statistical significant at the 99%
confidence level. It is worth noting that the values calculated for the multiple
correlation coefficients are higher: between 0.7 and 0.91 for the rain days and
between 0.7 and 0.9 for the amount of precipitation.
Figure 20 shows the long term variability of precipitation in Greece and the
frequencies of the "rainy" cyclonic types for winter. The high degree of association
between the two times series is evident. This figure shows that the significant
decrease of winter precipitation amounts just after 1970, come along with an also
significant fall in the frequency of occurrence of the "rainy" cyclonic circulation
types.
Table 3. Correlation coefficients (1) and mUltiple correlation coefficients (2) between seasonal
rain days and seasonal precipitation amounts and the frequencies of cyclonic circulation types
(500hPa, period 1958-1997) for Greece.
Season
Winter
Spring
Summer
Autumn
Days of precipitation
0.87
0.74
0.69
0.56
1
Precipitation
0.84
0.7
0.66
0.51
Days of precipitation
0.91
0.84
0.73
0.7
2
Precipitation
0.9
0.85
0.7
0.7
5 Extreme Episodes
In order to define the driest and the wettest years the technique of Principal
Component Analysis was applied on the annual data of precipitation amount for the
hydrological year that was defined as the period from September to August for the
time interval 1958 to 1997. The absolute higher negative score detected in the first
principal component without rotation defines the driest seasons or years. The same
definition may be drawn with respect to the wettest year, which also present the
highest values of positive scores.
Figure 21 shows the spatial distribution of percentage of precipitation of the
driest year 1989-1990 as compared to the average annual mean from September 1958
to August 1997. According to this figure the Aegean Sea and the Ionian Sea were
P. Maheras and C. Anagnostopoulou
circulation types on a seasonal basis, the correlation coefficients were calculated
between seasonal occurrence rain days and seasonal total precipitation and the
seasonal frequency of the "rainy" circulation types. The multiple correlation
coefficients between the same parameters were also calculated. The results obtained
are shown in Table 3 and reveal a high degree of association between the two
timeseries, with correlation between 0.56 and 0.87 for the days of rain and between
0.51 and 0.84 for the precipitation amounts, all statistical significant at the 99%
confidence level. It is worth noting that the values calculated for the multiple
correlation coefficients are higher: between 0.7 and 0.91 for the rain days and
between 0.7 and 0.9 for the amount of precipitation.
Figure 20 shows the long term variability of precipitation in Greece and the
frequencies of the "rainy" cyclonic types for winter. The high degree of association
between the two times series is evident. This figure shows that the significant
decrease of winter precipitation amounts just after 1970, come along with an also
significant fall in the frequency of occurrence of the "rainy" cyclonic circulation
types.
Table 3. Correlation coefficients (1) and mUltiple correlation coefficients (2) between seasonal
rain days and seasonal precipitation amounts and the frequencies of cyclonic circulation types
(500hPa, period 1958-1997) for Greece.
Season
Winter
Spring
Summer
Autumn
Days of precipitation
0.87
0.74
0.69
0.56
1
Precipitation
0.84
0.7
0.66
0.51
Days of precipitation
0.91
0.84
0.73
0.7
2
Precipitation
0.9
0.85
0.7
0.7
5 Extreme Episodes
In order to define the driest and the wettest years the technique of Principal
Component Analysis was applied on the annual data of precipitation amount for the
hydrological year that was defined as the period from September to August for the
time interval 1958 to 1997. The absolute higher negative score detected in the first
principal component without rotation defines the driest seasons or years. The same
definition may be drawn with respect to the wettest year, which also present the
highest values of positive scores.
Figure 21 shows the spatial distribution of percentage of precipitation of the
driest year 1989-1990 as compared to the average annual mean from September 1958
to August 1997. According to this figure the Aegean Sea and the Ionian Sea were