

Spatial and Temporal Variations in Precipitation and Aridity Index Series of Turkey
183
weather and climate. Observations and works related to hydrology and water
resources in Turkey are carried out by other governmental organizations.
For the time-series analysis of precipitation and aridity index series, this study
was carried out mainly by using monthly precipitation totals and monthly mean
temperatures, which were recorded at the 91 and 55 stations of the TSMS,
respectively, during the period 1929-1993. The data of 1929 was only used in
computing 1930 winter season. The lengths of records vary from 54 to 64 years for
precipitation data and from 42 to 64 years for temperature data. Division of the year
was made according to the basic seasons, as winter (December to February), spring
(March to May), summer (June to August) and autumn (September to November).
The precipitation data set had been broadly explained already by Tiirke~ (1995,
1996a). Missing values in monthly station records were replaced with the estimates
from nearby stations, only if the gaps in a station's record did not consist in more than
five per cent of the total number of monthly values in that station's record. This was
performed by using the normal ratio method, as described in Singh (1992). In this
procedure, three nearby reference stations were chosen by taking into account the
highest correlation coefficients (Pearson's r), between the base station to be filled and
the possible reference stations.
Statistical evaluations of homogeneity for the annual and seasonal precipitation
series, and annual aridity index and temperature series were made by using the nonparametric Kruskal-Wallis test for the homogeneity of means of the sub-periods
(Sneyers, 1990). For this study, homogeneity means that there is no jump in the
climatic series of observations. Jumps consist of non-climatological abrupt falls
and/or abrupt rises in the series. In order to make a more powerful assessment,
statistical results from the homogeneity test were also controlled by means of the
plotted graphs combined with the information available from the station history file.
Monthly precipitation and monthly mean temperature series were also subjected to
w
c
MEDITERRAN EAN d
SEA
J2"
•
•
•
• CMEO _____ --. ~ . _ '." ,--,----,
J;'-----;;
4,,'
4.t
Rainfall regions of Turkey
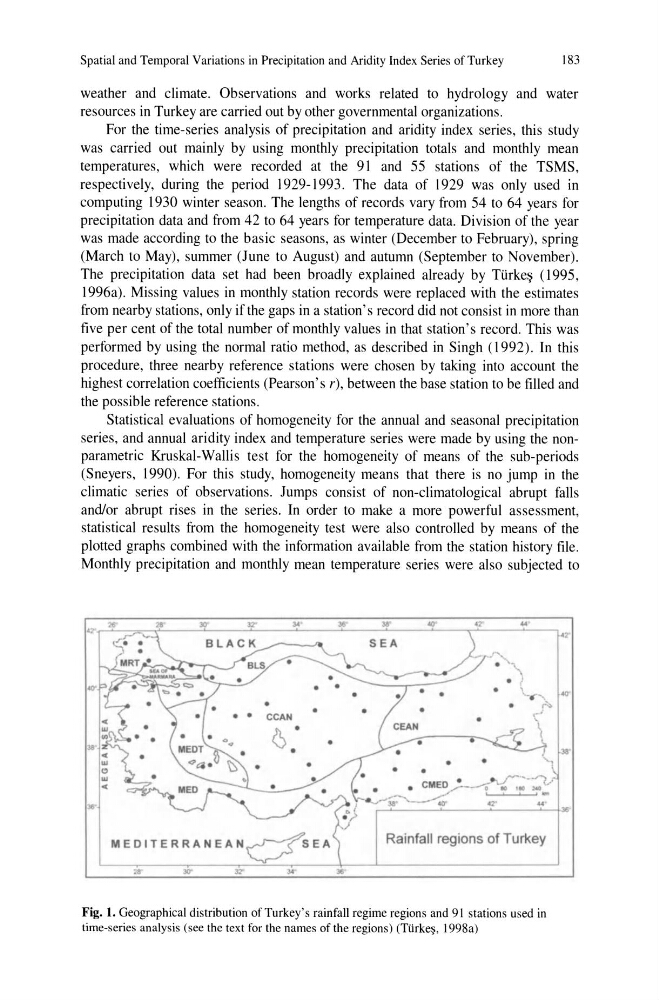
Fig. 1. Geographical distribution of Turkey's rainfall regime regions and 91 stations used in
time-series analysis (see the text for the names of the regions) (TUrke~, 1998a)
183
weather and climate. Observations and works related to hydrology and water
resources in Turkey are carried out by other governmental organizations.
For the time-series analysis of precipitation and aridity index series, this study
was carried out mainly by using monthly precipitation totals and monthly mean
temperatures, which were recorded at the 91 and 55 stations of the TSMS,
respectively, during the period 1929-1993. The data of 1929 was only used in
computing 1930 winter season. The lengths of records vary from 54 to 64 years for
precipitation data and from 42 to 64 years for temperature data. Division of the year
was made according to the basic seasons, as winter (December to February), spring
(March to May), summer (June to August) and autumn (September to November).
The precipitation data set had been broadly explained already by Tiirke~ (1995,
1996a). Missing values in monthly station records were replaced with the estimates
from nearby stations, only if the gaps in a station's record did not consist in more than
five per cent of the total number of monthly values in that station's record. This was
performed by using the normal ratio method, as described in Singh (1992). In this
procedure, three nearby reference stations were chosen by taking into account the
highest correlation coefficients (Pearson's r), between the base station to be filled and
the possible reference stations.
Statistical evaluations of homogeneity for the annual and seasonal precipitation
series, and annual aridity index and temperature series were made by using the nonparametric Kruskal-Wallis test for the homogeneity of means of the sub-periods
(Sneyers, 1990). For this study, homogeneity means that there is no jump in the
climatic series of observations. Jumps consist of non-climatological abrupt falls
and/or abrupt rises in the series. In order to make a more powerful assessment,
statistical results from the homogeneity test were also controlled by means of the
plotted graphs combined with the information available from the station history file.
Monthly precipitation and monthly mean temperature series were also subjected to
w
c
MEDITERRAN EAN d
SEA
J2"
•
•
•
• CMEO _____ --. ~ . _ '." ,--,----,
J;'-----;;
4,,'
4.t
Rainfall regions of Turkey
Fig. 1. Geographical distribution of Turkey's rainfall regime regions and 91 stations used in
time-series analysis (see the text for the names of the regions) (TUrke~, 1998a)