

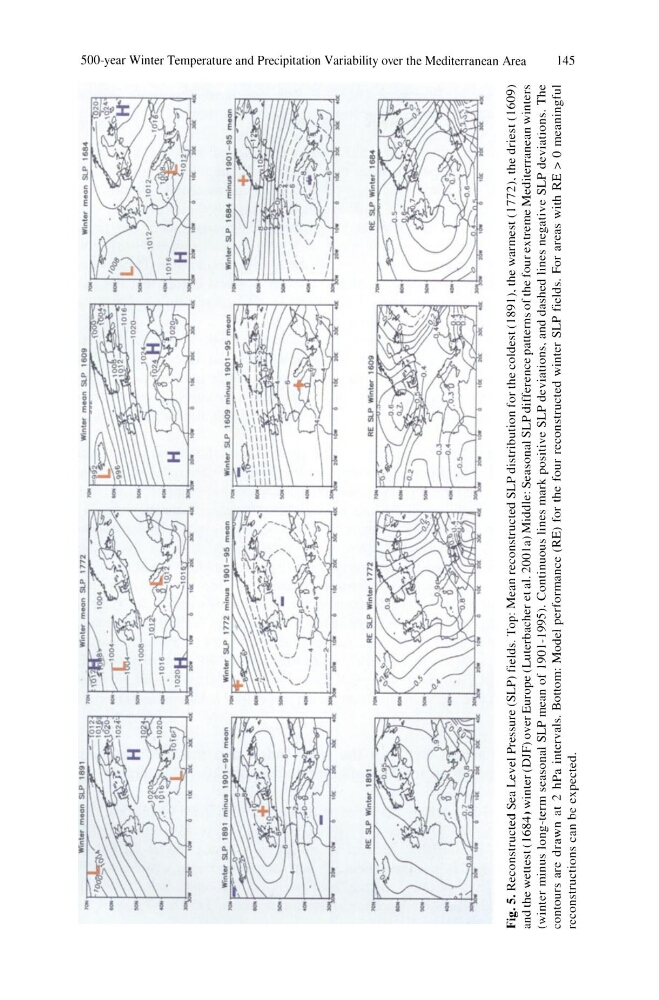
Fig. 5. Reconstructed Sea Level Pressure (SLP) fields, Top: Mean reconstructed SLP distribution for thc coldest ( 1891 ).
the warmest (1772),
the driest (1609)
and the wettest (1684)
winter (DJF) over Europe (Luterbacher et al. 200
I a) Middle: Seasonal SLP difference patterns of the four extreme Mediterranean winters
(winter minus long-term seasonal SLP mean of 1901-1995),
Continuous lines mark positive SLP deviations. and dashed lines negative SLP deviations, The
contours are
drawn at 2 hPa intervals, Bottom: Model performance (RE) for the four reconstructed winter SLP fields, For areas with RE >
0 meaningful
reconstructions
can be expected,
Vl
o
o
'ii
~
:;:::
5'
~
-l
(])
3
.",
~
' "
E'
(ii
' "
:;
0"0
Cl
(')
~:
~
g'
<:
~
~
q
o
~
5"
(])
a::
8~.
;::;
' "
:;
(])
'" :;
~
'"
"' "
Vl
the warmest (1772),
the driest (1609)
and the wettest (1684)
winter (DJF) over Europe (Luterbacher et al. 200
I a) Middle: Seasonal SLP difference patterns of the four extreme Mediterranean winters
(winter minus long-term seasonal SLP mean of 1901-1995),
Continuous lines mark positive SLP deviations. and dashed lines negative SLP deviations, The
contours are
drawn at 2 hPa intervals, Bottom: Model performance (RE) for the four reconstructed winter SLP fields, For areas with RE >
0 meaningful
reconstructions
can be expected,
Vl
o
o
'ii
~
:;:::
5'
~
-l
(])
3
.",
~
' "
E'
(ii
' "
:;
0"0
Cl
(')
~:
~
g'
<:
~
~
q
o
~
5"
(])
a::
8~.
;::;
' "
:;
(])
'" :;
~
'"
"' "
Vl