

SOO-year Winter Temperature and Precipitation Variability over the Mediterranean Area
137
estimations back to AD 1500. Second, we selected the period 1901-1960 for fitting
the statistical models. Both, the gridded temperature and precipitation and the
instrumental data together with the proxy based reconstructions for each
climatological season were transformed into Empirical Orthogonal Functions
(EOFs). The leading predictor data EOFs sharing 95% of total variance and the
leading temperature and precipitation EOFs explaining 90% of the total variability
70N'-- ~ ~ .- ~--------------------~~--~--~
a
eON
" 0
o
50N
o
o
o
>
.'
t
40N
, 0
o
o
30
- ~
N +---~-----+----~----~----------~~~
-30
-20
-10
0
10
20
30
40
120 b
110
~ 100
.s 90
u
:a 80
f! 70
e: 60
o 50
~ 40
~ 30
~ 20
z 10
Seasonal I
Monthly
•
O~ ____________ ~ ________________________ ~~
1500 1550 1600 1650 1700 1750
Year
1800 1850 1900 1950 2000
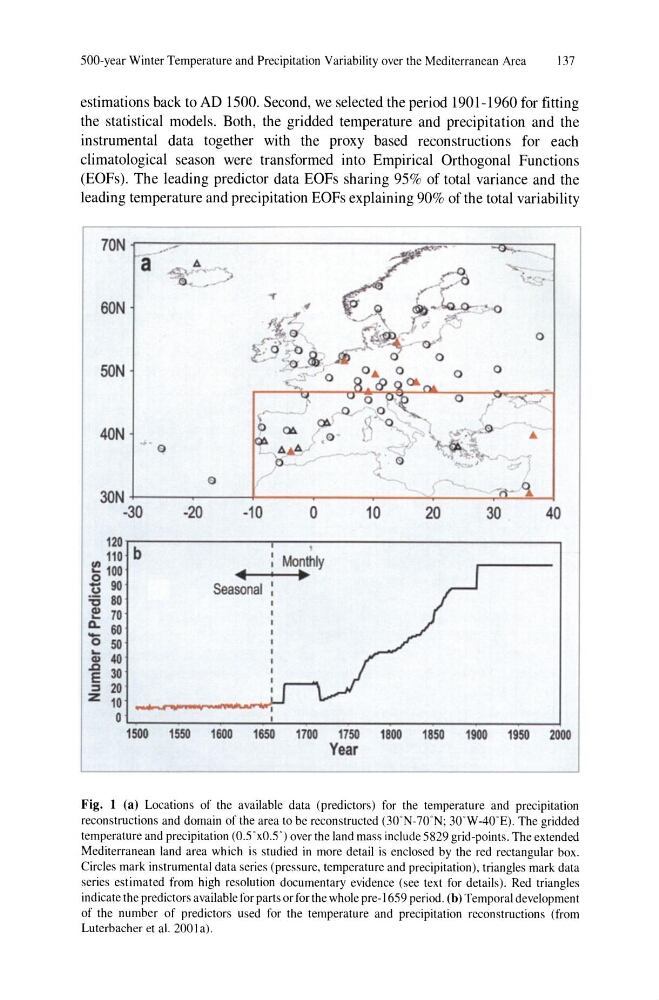
Fig, 1 (a) Locations of the available data (predictors) for the temperature and precipitation
reconstructions and domain of the area to be reconstructed (30'N-70 ' N; 30'W-40' E). The gridded
temperature and precipitation (OSxOS) over the land mass include S829 grid-points. The extended
Mediterranean land area which is studied in more detail is enclosed by thc red rectangular box.
Circles mark instrumental data series (pressure, temperature and precipitation), triangles mark data
series estimated from high resolution documentary evidence (see text for details). Red triangles
indicate the predictors available for parts or for the whole pre-16S9 period. (b) Temporal development
of the number of predictors used for the temperature and precipitation reconstructions (from
Luterbacher et al. 2001 a).
137
estimations back to AD 1500. Second, we selected the period 1901-1960 for fitting
the statistical models. Both, the gridded temperature and precipitation and the
instrumental data together with the proxy based reconstructions for each
climatological season were transformed into Empirical Orthogonal Functions
(EOFs). The leading predictor data EOFs sharing 95% of total variance and the
leading temperature and precipitation EOFs explaining 90% of the total variability
70N'-- ~ ~ .- ~--------------------~~--~--~
a
eON
" 0
o
50N
o
o
o
>
.'
t
40N
, 0
o
o
30
- ~
N +---~-----+----~----~----------~~~
-30
-20
-10
0
10
20
30
40
120 b
110
~ 100
.s 90
u
:a 80
f! 70
e: 60
o 50
~ 40
~ 30
~ 20
z 10
Seasonal I
Monthly
•
O~ ____________ ~ ________________________ ~~
1500 1550 1600 1650 1700 1750
Year
1800 1850 1900 1950 2000
Fig, 1 (a) Locations of the available data (predictors) for the temperature and precipitation
reconstructions and domain of the area to be reconstructed (30'N-70 ' N; 30'W-40' E). The gridded
temperature and precipitation (OSxOS) over the land mass include S829 grid-points. The extended
Mediterranean land area which is studied in more detail is enclosed by thc red rectangular box.
Circles mark instrumental data series (pressure, temperature and precipitation), triangles mark data
series estimated from high resolution documentary evidence (see text for details). Red triangles
indicate the predictors available for parts or for the whole pre-16S9 period. (b) Temporal development
of the number of predictors used for the temperature and precipitation reconstructions (from
Luterbacher et al. 2001 a).