

128
1. Palutikof
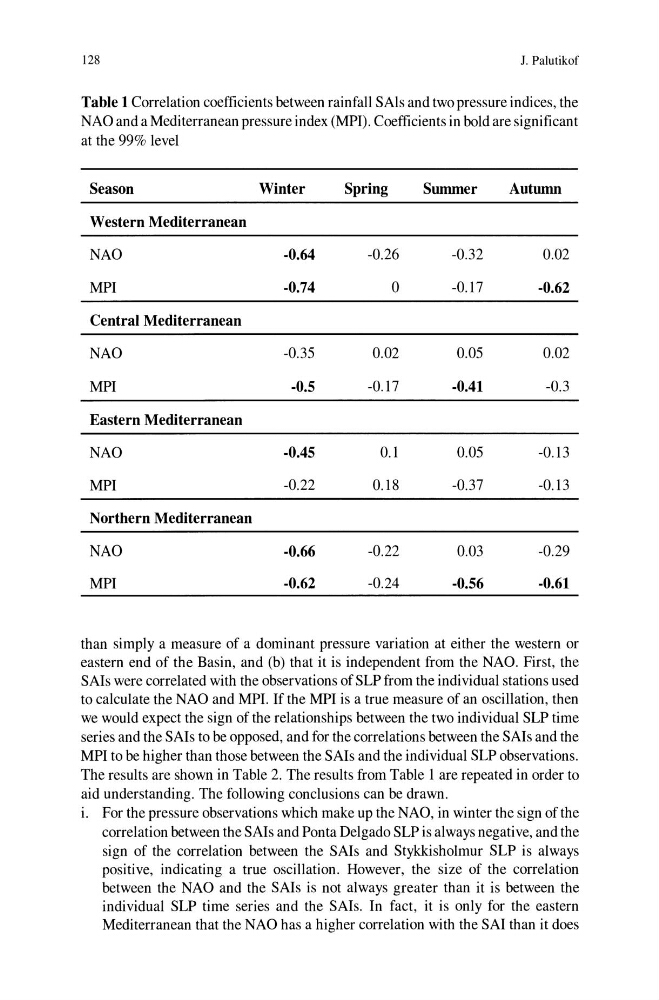
Table 1 Correlation coefficients between rainfall SAls and two pressure indices, the
NAO and a Mediterranean pressure index (MPI). Coefficients in bold are significant
at the 99% level
Season
Winter
Spring
Summer
Autumn
Western Mediterranean
NAO
-0.64
-0.26
-0.32
0.02
MPI
-0.74
0
-0.17
-0.62
Central Mediterranean
NAO
-0.35
0.02
0.05
0.02
MPI
-0.5
-0.17
-0.41
-0.3
Eastern Mediterranean
NAO
-0.45
0.1
0.05
-0.13
MPI
-0.22
0.18
-0.37
-0.13
Northern Mediterranean
NAO
-0.66
-0.22
0.03
-0.29
MPI
-0.62
-0.24
-0.56
-0.61
than simply a measure of a dominant pressure variation at either the western or
eastern end of the Basin, and (b) that it is independent from the NAO. First, the
SAIs were correlated with the observations of SLP from the individual stations used
to calculate the NAO and MPI. Ifthe MPI is a true measure of an oscillation, then
we would expect the sign ofthe relationships between the two individual SLP time
series and the SAIs to be opposed, and for the correlations between the SAIs and the
MPI to be higher than those between the SAIs and the individual SLP observations.
The results are shown in Table 2. The results from Table I are repeated in order to
aid understanding. The following conclusions can be drawn.
1. For the pressure observations which make up the NAO, in winter the sign ofthe
correlation between the SAIs and Ponta Delgado SLP is always negative, and the
sign of the correlation between the SAIs and Stykkisholmur SLP is always
positive, indicating a true oscillation. However, the size of the correlation
between the NAG and the SAls is not always greater than it is between the
individual SLP time series and the SAls. In fact, it is only for the eastern
Mediterranean that the NAG has a higher correlation with the SAl than it does
1. Palutikof
Table 1 Correlation coefficients between rainfall SAls and two pressure indices, the
NAO and a Mediterranean pressure index (MPI). Coefficients in bold are significant
at the 99% level
Season
Winter
Spring
Summer
Autumn
Western Mediterranean
NAO
-0.64
-0.26
-0.32
0.02
MPI
-0.74
0
-0.17
-0.62
Central Mediterranean
NAO
-0.35
0.02
0.05
0.02
MPI
-0.5
-0.17
-0.41
-0.3
Eastern Mediterranean
NAO
-0.45
0.1
0.05
-0.13
MPI
-0.22
0.18
-0.37
-0.13
Northern Mediterranean
NAO
-0.66
-0.22
0.03
-0.29
MPI
-0.62
-0.24
-0.56
-0.61
than simply a measure of a dominant pressure variation at either the western or
eastern end of the Basin, and (b) that it is independent from the NAO. First, the
SAIs were correlated with the observations of SLP from the individual stations used
to calculate the NAO and MPI. Ifthe MPI is a true measure of an oscillation, then
we would expect the sign ofthe relationships between the two individual SLP time
series and the SAIs to be opposed, and for the correlations between the SAIs and the
MPI to be higher than those between the SAIs and the individual SLP observations.
The results are shown in Table 2. The results from Table I are repeated in order to
aid understanding. The following conclusions can be drawn.
1. For the pressure observations which make up the NAO, in winter the sign ofthe
correlation between the SAIs and Ponta Delgado SLP is always negative, and the
sign of the correlation between the SAIs and Stykkisholmur SLP is always
positive, indicating a true oscillation. However, the size of the correlation
between the NAG and the SAls is not always greater than it is between the
individual SLP time series and the SAls. In fact, it is only for the eastern
Mediterranean that the NAG has a higher correlation with the SAl than it does