

26
Gilberto Rodriguez
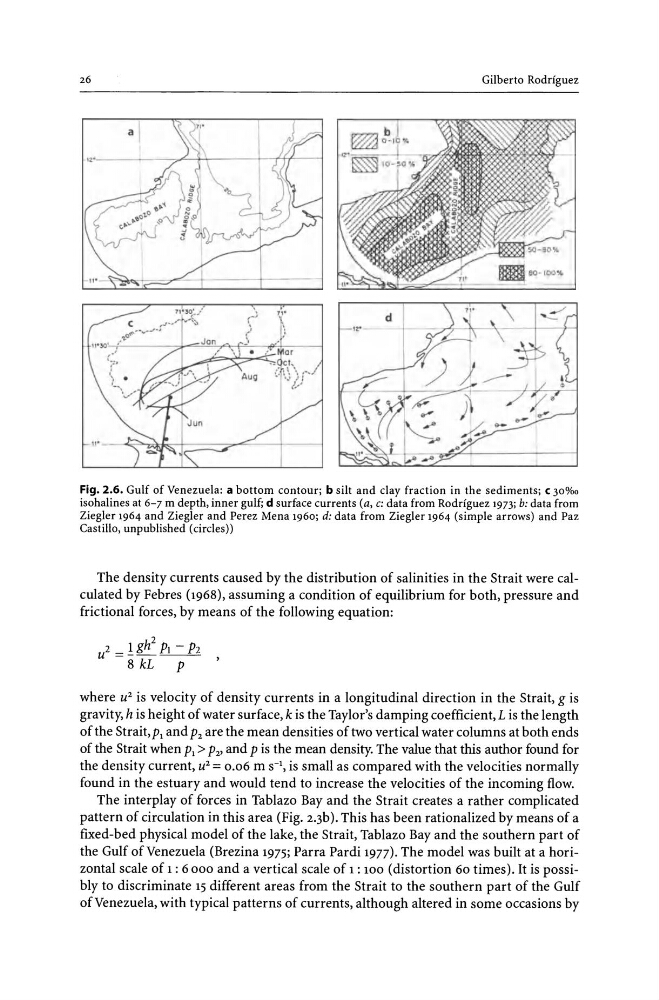
Fig. 2.6. Gulf of Venezuela: a bottom contour; b silt and clay fraction in the sediments; c 30%0
isohalines at 6-7 m depth, inner gulf; d surface currents (a, c: data from Rodriguez 1973; b: data from
Ziegler 1964 and Ziegler and Perez Mena 1960; d: data from Ziegler 1964 (simple arrows) and Paz
Castillo, unpublished (circles))
The density currents caused by the distribution of salinities in the Strait were calculated by Febres (1968), assuming a condition of equilibrium for both, pressure and
frictional forces, by means of the following equation:
2 _ 1 gh2 PI - P2
U - - - - - -
8 kL
P
where u 2 is velocity of density currents in a longitudinal direction in the Strait, g is
gravity, h is height of water surface, k is the Taylor's damping coefficient, L is the length
of the Strait, p, and P2 are the mean densities of two vertical water columns at both ends
of the Strait when p, > pz, and P is the mean density. The value that this author found for
the density current, u 2 = 0.06 m s-', is small as compared with the velocities normally
found in the estuary and would tend to increase the velocities of the incoming flow.
The interplay of forces in Tablazo Bay and the Strait creates a rather complicated
pattern of circulation in this area (Fig. 2.3b). This has been rationalized by means of a
fixed-bed physical model of the lake, the Strait, Tablazo Bay and the southern part of
the Gulf of Venezuela (Brezina 1975; Parra Pardi 1977). The model was built at a horizontal scale of 1: 6000 and a vertical scale of 1: 100 (distortion 60 times). It is possibly to discriminate 15 different areas from the Strait to the southern part of the Gulf
of Venezuela, with typical patterns of currents, although altered in some occasions by
Gilberto Rodriguez
Fig. 2.6. Gulf of Venezuela: a bottom contour; b silt and clay fraction in the sediments; c 30%0
isohalines at 6-7 m depth, inner gulf; d surface currents (a, c: data from Rodriguez 1973; b: data from
Ziegler 1964 and Ziegler and Perez Mena 1960; d: data from Ziegler 1964 (simple arrows) and Paz
Castillo, unpublished (circles))
The density currents caused by the distribution of salinities in the Strait were calculated by Febres (1968), assuming a condition of equilibrium for both, pressure and
frictional forces, by means of the following equation:
2 _ 1 gh2 PI - P2
U - - - - - -
8 kL
P
where u 2 is velocity of density currents in a longitudinal direction in the Strait, g is
gravity, h is height of water surface, k is the Taylor's damping coefficient, L is the length
of the Strait, p, and P2 are the mean densities of two vertical water columns at both ends
of the Strait when p, > pz, and P is the mean density. The value that this author found for
the density current, u 2 = 0.06 m s-', is small as compared with the velocities normally
found in the estuary and would tend to increase the velocities of the incoming flow.
The interplay of forces in Tablazo Bay and the Strait creates a rather complicated
pattern of circulation in this area (Fig. 2.3b). This has been rationalized by means of a
fixed-bed physical model of the lake, the Strait, Tablazo Bay and the southern part of
the Gulf of Venezuela (Brezina 1975; Parra Pardi 1977). The model was built at a horizontal scale of 1: 6000 and a vertical scale of 1: 100 (distortion 60 times). It is possibly to discriminate 15 different areas from the Strait to the southern part of the Gulf
of Venezuela, with typical patterns of currents, although altered in some occasions by