

CHAPTER 8 . Physical Characteristics and Processes of the Rio de la Plata Estuary
181
8.5.1
Seasonal Distribution
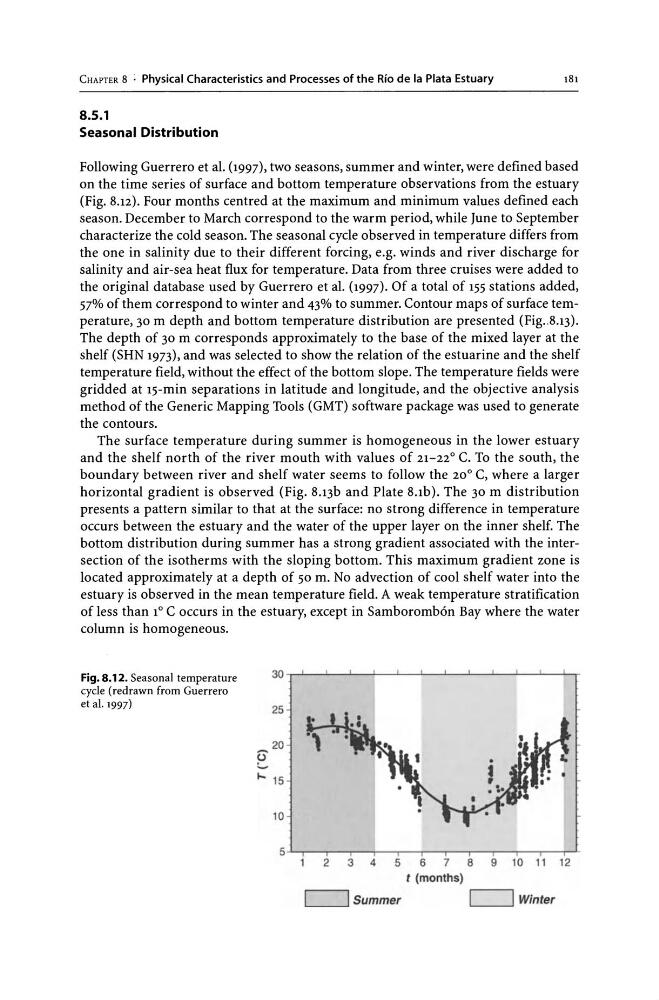
Following Guerrero et al. (1997), two seasons, summer and winter, were defined based
on the time series of surface and bottom temperature observations from the estuary
(Fig. 8.12). Four months centred at the maximum and minimum values defined each
season. December to March correspond to the warm period, while June to September
characterize the cold season. The seasonal cycle observed in temperature differs from
the one in salinity due to their different forcing, e.g. winds and river discharge for
salinity and air-sea heat flux for temperature. Data from three cruises were added to
the original database used by Guerrero et al. (1997). Of a total of 155 stations added,
5iYo of them correspond to winter and 43% to summer. Contour maps of surface temperature, 30 m depth and bottom temperature distribution are presented (Fig .. 8.13).
The depth of 30 m corresponds approximately to the base of the mixed layer at the
shelf (SHN 1973), and was selected to show the relation of the estuarine and the shelf
temperature field, without the effect of the bottom slope. The temperature fields were
gridded at Is-min separations in latitude and longitude, and the objective analysis
method of the Generic Mapping Tools (GMT) software package was used to generate
the contours.
The surface temperature during summer is homogeneous in the lower estuary
and the shelf north of the river mouth with values of 21-22° C. To the south, the
boundary between river and shelf water seems to follow the 20° C, where a larger
horizontal gradient is observed (Fig. 8.13b and Plate 8.1b). The 30 m distribution
presents a pattern similar to that at the surface: no strong difference in temperature
occurs between the estuary and the water of the upper layer on the inner shelf. The
bottom distribution during summer has a strong gradient associated with the intersection of the isotherms with the sloping bottom. This maximum gradient zone is
located approximately at a depth of 50 m. No advection of cool shelf water into the
estuary is observed in the mean temperature field. A weak temperature stratification
of less than 1° C occurs in the estuary, except in Samboromb6n Bay where the water
column is homogeneous.
Fig. 8.12. Seasonal temperature
cycle (redrawn from Guerrero
et al. 1997)
25
20
E
.... 15
10
2
3
4
5
6
7
8
9 10 11 12
t (months)
L=:::J Summer
L=:::J Winter
181
8.5.1
Seasonal Distribution
Following Guerrero et al. (1997), two seasons, summer and winter, were defined based
on the time series of surface and bottom temperature observations from the estuary
(Fig. 8.12). Four months centred at the maximum and minimum values defined each
season. December to March correspond to the warm period, while June to September
characterize the cold season. The seasonal cycle observed in temperature differs from
the one in salinity due to their different forcing, e.g. winds and river discharge for
salinity and air-sea heat flux for temperature. Data from three cruises were added to
the original database used by Guerrero et al. (1997). Of a total of 155 stations added,
5iYo of them correspond to winter and 43% to summer. Contour maps of surface temperature, 30 m depth and bottom temperature distribution are presented (Fig .. 8.13).
The depth of 30 m corresponds approximately to the base of the mixed layer at the
shelf (SHN 1973), and was selected to show the relation of the estuarine and the shelf
temperature field, without the effect of the bottom slope. The temperature fields were
gridded at Is-min separations in latitude and longitude, and the objective analysis
method of the Generic Mapping Tools (GMT) software package was used to generate
the contours.
The surface temperature during summer is homogeneous in the lower estuary
and the shelf north of the river mouth with values of 21-22° C. To the south, the
boundary between river and shelf water seems to follow the 20° C, where a larger
horizontal gradient is observed (Fig. 8.13b and Plate 8.1b). The 30 m distribution
presents a pattern similar to that at the surface: no strong difference in temperature
occurs between the estuary and the water of the upper layer on the inner shelf. The
bottom distribution during summer has a strong gradient associated with the intersection of the isotherms with the sloping bottom. This maximum gradient zone is
located approximately at a depth of 50 m. No advection of cool shelf water into the
estuary is observed in the mean temperature field. A weak temperature stratification
of less than 1° C occurs in the estuary, except in Samboromb6n Bay where the water
column is homogeneous.
Fig. 8.12. Seasonal temperature
cycle (redrawn from Guerrero
et al. 1997)
25
20
E
.... 15
10
2
3
4
5
6
7
8
9 10 11 12
t (months)
L=:::J Summer
L=:::J Winter