

112
M. Cintia Piccolo . Gerardo M.E. Perillo
both layers. On the upper one, the flow is seaward practically during all the tidal cycle. The currents for the bottom layer are very small «lO cm S-I), specially near the
harbour-head step, and having random directions (Cuadrado and Perillo 1996). It is
apparent that the tide enters on the bottom and actually push up the upper layer which
is flowing seaward.
Lanfredi et al. (1988) have studied the variations of the mean sea level in Puerto
Quequen. They analysed 64 years of hourly tidal heights and obtained the long term
trend of 1.6 mm yc 1 • The tide is predominantly semi-diurnal, mixed. Mean tidal range
is 0.89 m. Yearly maximum tides were analysed by Piccolo and Perillo (1997a) for the
period 1958-1994. The highest values were registered in 1962 and 1979 with 3-l m. The
most important astronomical components are the M 2 , 0 1 and K 1 • Restricting the analysis to the period 1989-1993 and to the three main constants. Table 6.3 shows significant annual variations in amplitude and phase.
Piccolo and Perillo (1997a) have also studied the hourly departures of observed tides
from predicted ones (storm surges). They presented maximum values of 1.5 m and
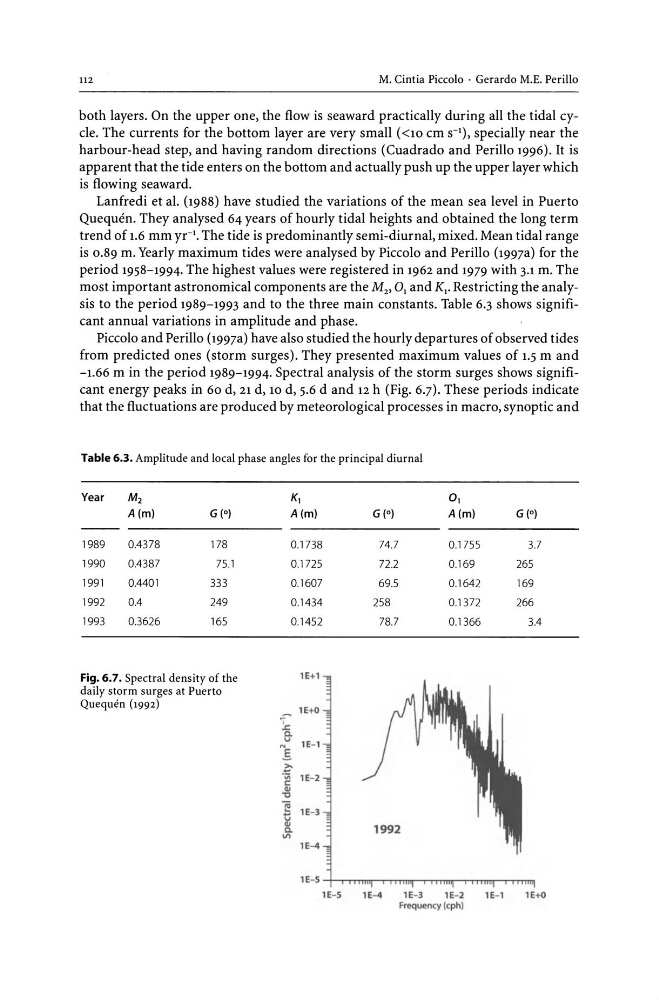
-1.66 m in the period 1989-1994. Spectral analysis of the storm surges shows significant energy peaks in 60 d, 21 d, 10 d, 5.6 d and 12 h (Fig. 6.7). These periods indicate
that the fluctuations are produced by meteorological processes in macro, synoptic and
Table 6.3. Amplitude and local phase angles for the principal diurnal
Year
M2
K,
0 ,
A(m)
G(o)
A(m)
G(O)
A(m)
G(O)
1989
0.4378
178
0.1738
74.7
0.1755
3.7
1990
0.4387
75.1
0.1725
72.2
0.169
265
1991
0.4401
333
0.1607
69.5
0.1642
169
1992
0.4
249
0.1434
258
0.1372
266
1993
0.3626
165
0.1452
78.7
0.1366
3.4
Fig. 6.7. Spectral density of the
lE+l
daily storm surges at Puerto
Quequen (1992)
lE+O
,
.J:.
a.
... IE- I
1
>...
. ;;; lE-2
c:
' "
""C
~ lE- 3
u
'" a.
Vl
lE-4
IE- 5
lE- 5
lE-4
lE- 3
lE- 2
lE- l
lE+O
Frequency (cph)
M. Cintia Piccolo . Gerardo M.E. Perillo
both layers. On the upper one, the flow is seaward practically during all the tidal cycle. The currents for the bottom layer are very small «lO cm S-I), specially near the
harbour-head step, and having random directions (Cuadrado and Perillo 1996). It is
apparent that the tide enters on the bottom and actually push up the upper layer which
is flowing seaward.
Lanfredi et al. (1988) have studied the variations of the mean sea level in Puerto
Quequen. They analysed 64 years of hourly tidal heights and obtained the long term
trend of 1.6 mm yc 1 • The tide is predominantly semi-diurnal, mixed. Mean tidal range
is 0.89 m. Yearly maximum tides were analysed by Piccolo and Perillo (1997a) for the
period 1958-1994. The highest values were registered in 1962 and 1979 with 3-l m. The
most important astronomical components are the M 2 , 0 1 and K 1 • Restricting the analysis to the period 1989-1993 and to the three main constants. Table 6.3 shows significant annual variations in amplitude and phase.
Piccolo and Perillo (1997a) have also studied the hourly departures of observed tides
from predicted ones (storm surges). They presented maximum values of 1.5 m and
-1.66 m in the period 1989-1994. Spectral analysis of the storm surges shows significant energy peaks in 60 d, 21 d, 10 d, 5.6 d and 12 h (Fig. 6.7). These periods indicate
that the fluctuations are produced by meteorological processes in macro, synoptic and
Table 6.3. Amplitude and local phase angles for the principal diurnal
Year
M2
K,
0 ,
A(m)
G(o)
A(m)
G(O)
A(m)
G(O)
1989
0.4378
178
0.1738
74.7
0.1755
3.7
1990
0.4387
75.1
0.1725
72.2
0.169
265
1991
0.4401
333
0.1607
69.5
0.1642
169
1992
0.4
249
0.1434
258
0.1372
266
1993
0.3626
165
0.1452
78.7
0.1366
3.4
Fig. 6.7. Spectral density of the
lE+l
daily storm surges at Puerto
Quequen (1992)
lE+O
,
.J:.
a.
... IE- I
1
>...
. ;;; lE-2
c:
' "
""C
~ lE- 3
u
'" a.
Vl
lE-4
IE- 5
lE- 5
lE-4
lE- 3
lE- 2
lE- l
lE+O
Frequency (cph)