

Osmar O. Moller Jr .. Patrice Castaing
It is not related to the mean flow, which is seaward as depicted from the velocity distribution. Rather these salinity oscillations are related with the tidal action that has reversed the flow in the deeper parts (17-18 m) of the channel and forced the entrainment
of salt water into shallower depths. Following the 6 psu isoline one can observe that its
vertical displacement has a velocity of 0.8 m h- 1 • During this period the system is still
under the action of light SW winds (2-3 m S-I). The bending of the current velocity
isolines may be the result of an incomplete filtering. A common feature among these
three series is that well mixed conditions are forced by the advection of large amounts
of coastal waters that displace the salinity front towards the inner parts of the lagoon.
5.4.3
Estuarine Classification of the Channel Area
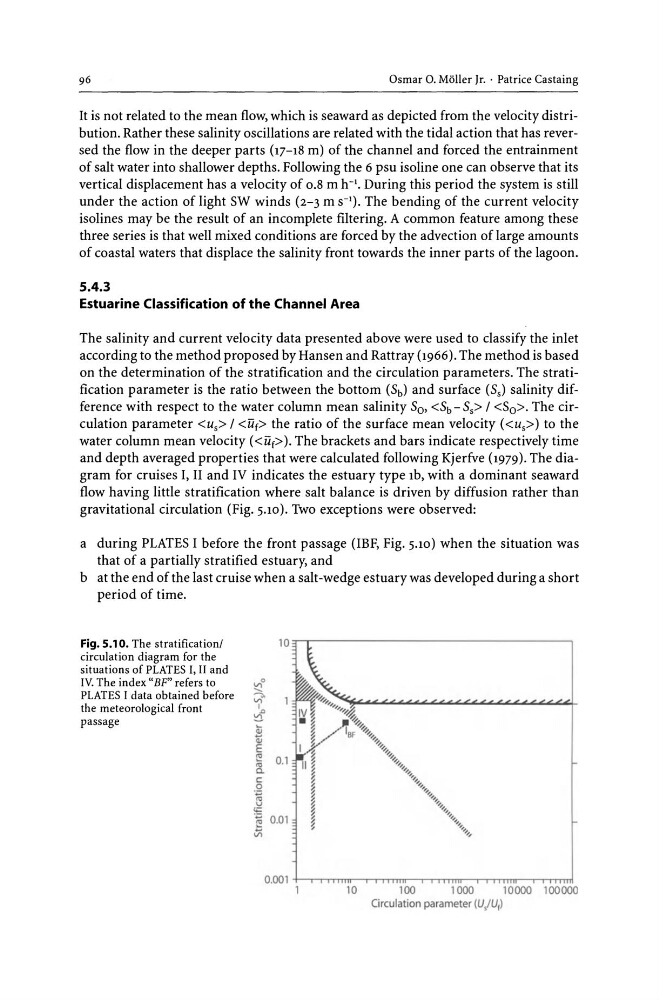
The salinity and current velocity data presented above were used to classify the inlet
according to the method proposed by Hansen and Rattray (1966). The method is based
on the determination of the stratification and the circulation parameters. The stratification parameter is the ratio between the bottom (5 b ) and surface (5s) salinity difference with respect to the water column mean salinity 50' <5b - 5s> /, The circulation parameter / the ratio of the surface mean velocity «us» to the
water column mean velocity «Uf»' The brackets and bars indicate respectively time
and depth averaged properties that were calculated following Kjerfve (1979). The diagram for cruises I, II and IV indicates the estuary type 1b, with a dominant seaward
flow having little stratification where salt balance is driven by diffusion rather than
gravitational circulation (Fig. 5.10). Two exceptions were observed:
a during PLATES I before the front passage (IBF, Fig. 5.10) when the situation was
that of a partially stratified estuary, and
b at the end of the last cruise when a salt-wedge estuary was developed during a short
period of time.
Fig. 5.10. The stratification/
circulation diagram for the
situations of PLATES I, II and
IV. The index "BF" refers to
PLATES I data obtained before
the meteorological front
passage
10~r---------------------------------~
0.00 1 +-.,....,.TTTmr--.-""'-rTmrr-.,....,.TTTmr--'-""'-rTTTlrr-"T""T-rTT-mI
10
100
1000
10000 100000
Circulation parameter (U/U r )
It is not related to the mean flow, which is seaward as depicted from the velocity distribution. Rather these salinity oscillations are related with the tidal action that has reversed the flow in the deeper parts (17-18 m) of the channel and forced the entrainment
of salt water into shallower depths. Following the 6 psu isoline one can observe that its
vertical displacement has a velocity of 0.8 m h- 1 • During this period the system is still
under the action of light SW winds (2-3 m S-I). The bending of the current velocity
isolines may be the result of an incomplete filtering. A common feature among these
three series is that well mixed conditions are forced by the advection of large amounts
of coastal waters that displace the salinity front towards the inner parts of the lagoon.
5.4.3
Estuarine Classification of the Channel Area
The salinity and current velocity data presented above were used to classify the inlet
according to the method proposed by Hansen and Rattray (1966). The method is based
on the determination of the stratification and the circulation parameters. The stratification parameter is the ratio between the bottom (5 b ) and surface (5s) salinity difference with respect to the water column mean salinity 50' <5b - 5s> /
water column mean velocity «Uf»' The brackets and bars indicate respectively time
and depth averaged properties that were calculated following Kjerfve (1979). The diagram for cruises I, II and IV indicates the estuary type 1b, with a dominant seaward
flow having little stratification where salt balance is driven by diffusion rather than
gravitational circulation (Fig. 5.10). Two exceptions were observed:
a during PLATES I before the front passage (IBF, Fig. 5.10) when the situation was
that of a partially stratified estuary, and
b at the end of the last cruise when a salt-wedge estuary was developed during a short
period of time.
Fig. 5.10. The stratification/
circulation diagram for the
situations of PLATES I, II and
IV. The index "BF" refers to
PLATES I data obtained before
the meteorological front
passage
10~r---------------------------------~
0.00 1 +-.,....,.TTTmr--.-""'-rTmrr-.,....,.TTTmr--'-""'-rTTTlrr-"T""T-rTT-mI
10
100
1000
10000 100000
Circulation parameter (U/U r )