

94
Osmar O. Moller Jr .. Patrice Castaing
14
12
10 a
,
~
8
.s
6
4
~
2
'g 0
a; -2
,. -4
"0
-6
c
§ -8
-10
- 12
- 14 0
25
50
7S
100
0.5
0.4 b
0.3
:[ 0.2
a; 0,1
,.
~
0
~ -0.1
~ -{l,2
-{l3
-{l.4
-{l.5
25
50
75
100
1.5
. .
C
~
E
;; 0,5
'g
a;
U o
,.
E -{l.5
~
:l
- I
U
- 1.5 0
25
50
75
35
--25
~ 20
:~
"lij
15
Vl
10
0
25
50
75
100
Time (h)
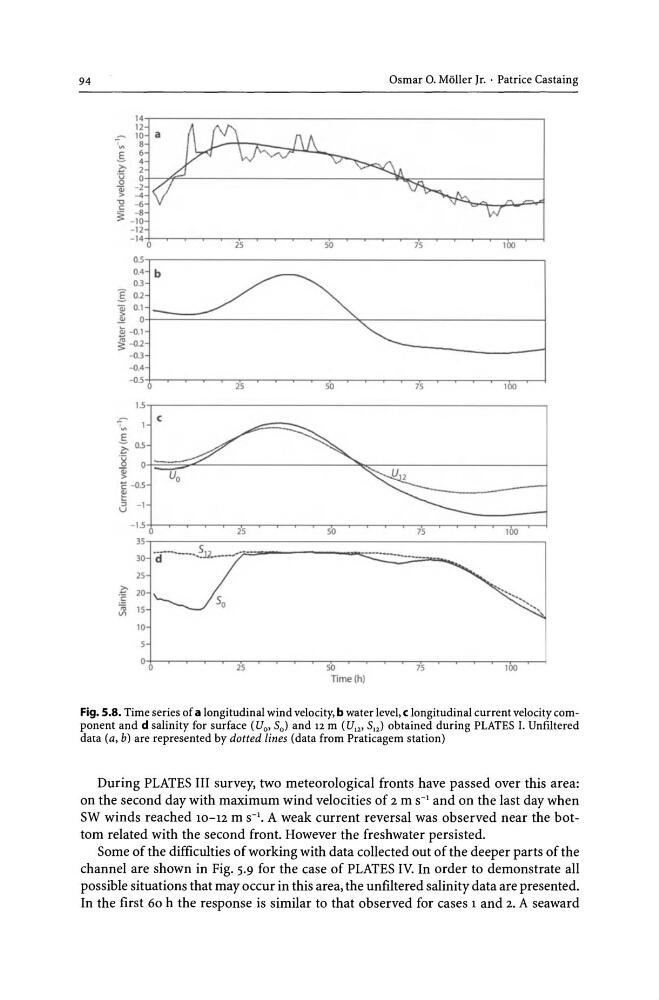
Fig. 5.8. Time series of a longitudinal wind velocity, b water level, c longitudinal current velocity component and d salinity for surface (Uo' So) and 12 m (U'2' 512 ) obtained during PLATES I. Unfiltered
data (a, b) are represented by dotted lines (data from Praticagem station)
During PLATES III survey, two meteorological fronts have passed over this area:
on the second day with maximum wind velocities of 2 m s-' and on the last day when
SW winds reached 10-12 m s-'. A weak current reversal was observed near the bottom related with the second front. However the freshwater persisted.
Some of the difficulties of working with data collected out of the deeper parts of the
channel are shown in Fig. 5.9 for the case of PLATES IV. In order to demonstrate all
possible situations that may occur in this area, the unfiltered salinity data are presented.
In the first 60 h the response is similar to that observed for cases 1 and 2. A seaward
Osmar O. Moller Jr .. Patrice Castaing
14
12
10 a
,
~
8
.s
6
4
~
2
'g 0
a; -2
,. -4
"0
-6
c
§ -8
-10
- 12
- 14 0
25
50
7S
100
0.5
0.4 b
0.3
:[ 0.2
a; 0,1
,.
~
0
~ -0.1
~ -{l,2
-{l3
-{l.4
-{l.5
25
50
75
100
1.5
. .
C
~
E
;; 0,5
'g
a;
U o
,.
E -{l.5
~
:l
- I
U
- 1.5 0
25
50
75
35
--25
~ 20
:~
"lij
15
Vl
10
0
25
50
75
100
Time (h)
Fig. 5.8. Time series of a longitudinal wind velocity, b water level, c longitudinal current velocity component and d salinity for surface (Uo' So) and 12 m (U'2' 512 ) obtained during PLATES I. Unfiltered
data (a, b) are represented by dotted lines (data from Praticagem station)
During PLATES III survey, two meteorological fronts have passed over this area:
on the second day with maximum wind velocities of 2 m s-' and on the last day when
SW winds reached 10-12 m s-'. A weak current reversal was observed near the bottom related with the second front. However the freshwater persisted.
Some of the difficulties of working with data collected out of the deeper parts of the
channel are shown in Fig. 5.9 for the case of PLATES IV. In order to demonstrate all
possible situations that may occur in this area, the unfiltered salinity data are presented.
In the first 60 h the response is similar to that observed for cases 1 and 2. A seaward