

268
6 Quantitative Aspects of Analytical Chemistry
Box 6.11
Instrumental Indicators in Titrimetries
Instead of the human senses, one can use instruments to monitor changes in the ingredients
(A, R or P) of the main titrimetric reaction during the process. The instrument response is a
titration curve, viz. a plot of the variation of the measured signal (instrumenta l parameter, P)
with the volume (mL) of titrant added. Depending on the relationship between the instrumental parameter, P. and the ingredient concentrations, two types of curve (logarithmic
or linear) can be obtained:
Logarithmic
Linear
P
P
I
I
EP
mL orR
EP
I
I
I
P = k(B)
I
I
I
I
I
I
mLofR
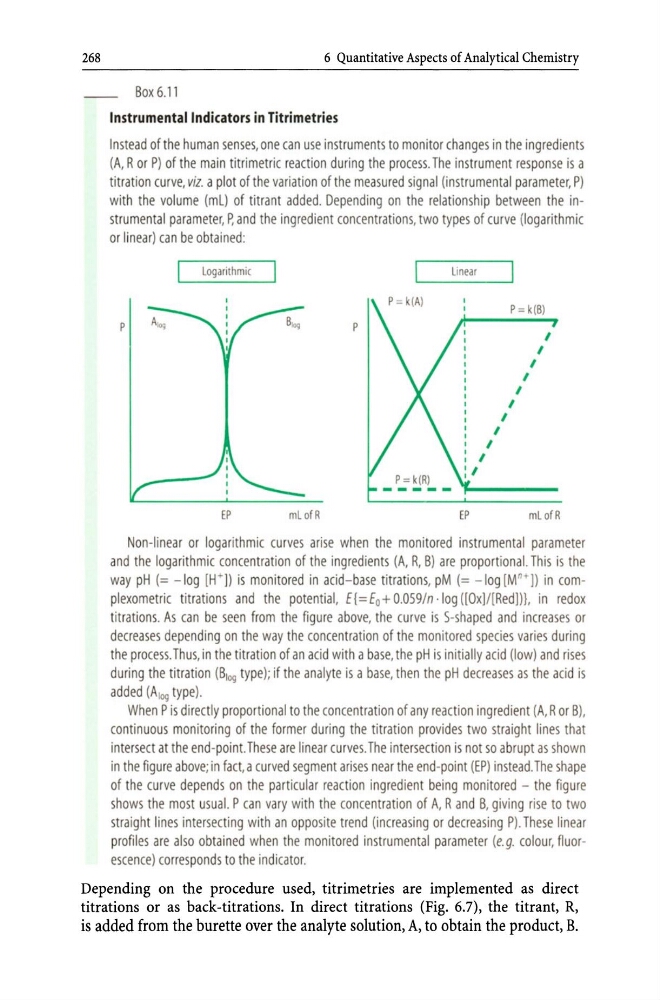
Non-linear or logarithmic curves arise when the monitored instrumental parameter
and the logarithmic concentration of the ingredients (A, R, B) are proportional. This is the
way pH (= -log [W]) is monitored in acid- base titrations, pM (= - log [M" J) in complexometric titrations and the potential, E{ = Eo + O.059/n · log ([Ox]J[Redlll, in redox
titrations. As can be seen from the figure above, the curve is S-shaped and increases or
decreases depending on the way the concentration of the monitored species varies during
the process. Thus, in the titration of an acid with a base, the pH is initially acid (low) and rises
during the titration (Blog type); if the analyte is a base, then the pH decreases as the acid is
added (A log type).
When P is directly proportional to the concentration of any reaction ingredient (A, R or B),
continuous monitoring of the former during the titration provides two straight lines that
intersect at the end-point. These are linear curves. The intersection is not so abrupt as shown
in the figure above; in fact, a curved segment arises near the end-point (EP) instead. The shape
of the curve depends on the particular reaction ingredient being monitored - the figure
shows the most usual. P can vary with the concentration of A, Rand B, giving rise to two
straight lines intersecting with an opposite trend (increasing or decreasing Pl. These linear
profiles are also obtained when the monitored instrumental parameter (e. g. colour, fluorescence) corresponds to the indicator.
Depending on the procedure used, titrimetries are implemented as direct
tit rations or as back-titrations. In direct tit rations (Fig. 6.7), the titrant, R,
is added from the burette over the analyte solution, A, to obtain the product, B.
6 Quantitative Aspects of Analytical Chemistry
Box 6.11
Instrumental Indicators in Titrimetries
Instead of the human senses, one can use instruments to monitor changes in the ingredients
(A, R or P) of the main titrimetric reaction during the process. The instrument response is a
titration curve, viz. a plot of the variation of the measured signal (instrumenta l parameter, P)
with the volume (mL) of titrant added. Depending on the relationship between the instrumental parameter, P. and the ingredient concentrations, two types of curve (logarithmic
or linear) can be obtained:
Logarithmic
Linear
P
P
I
I
EP
mL orR
EP
I
I
I
P = k(B)
I
I
I
I
I
I
mLofR
Non-linear or logarithmic curves arise when the monitored instrumental parameter
and the logarithmic concentration of the ingredients (A, R, B) are proportional. This is the
way pH (= -log [W]) is monitored in acid- base titrations, pM (= - log [M" J) in complexometric titrations and the potential, E{ = Eo + O.059/n · log ([Ox]J[Redlll, in redox
titrations. As can be seen from the figure above, the curve is S-shaped and increases or
decreases depending on the way the concentration of the monitored species varies during
the process. Thus, in the titration of an acid with a base, the pH is initially acid (low) and rises
during the titration (Blog type); if the analyte is a base, then the pH decreases as the acid is
added (A log type).
When P is directly proportional to the concentration of any reaction ingredient (A, R or B),
continuous monitoring of the former during the titration provides two straight lines that
intersect at the end-point. These are linear curves. The intersection is not so abrupt as shown
in the figure above; in fact, a curved segment arises near the end-point (EP) instead. The shape
of the curve depends on the particular reaction ingredient being monitored - the figure
shows the most usual. P can vary with the concentration of A, Rand B, giving rise to two
straight lines intersecting with an opposite trend (increasing or decreasing Pl. These linear
profiles are also obtained when the monitored instrumental parameter (e. g. colour, fluorescence) corresponds to the indicator.
Depending on the procedure used, titrimetries are implemented as direct
tit rations or as back-titrations. In direct tit rations (Fig. 6.7), the titrant, R,
is added from the burette over the analyte solution, A, to obtain the product, B.