

4.5 Signal Acquisition and Data Processing
171
such as nuclear magnetic resonance spectrometers, are preferred for structural
analysis.
~ Signal Acquisition and Data Processing
The third step of a CMP can be considered the link between the measuring
instrument (second step) and the results, expressed in the required format (see
Fig. 4.4). The subsequent materialization in a report (Fig. 1.15) is within the
scope of the analytical problem (Chap. 7).
This step involves two sequential sub-steps, namely:
Acquisition of transduced signals, which are the raw (absorbance, mass, current
intensity) data obtained from the measurement process (see Fig. 1.15). Data can
be acquired manually (e. g. by inspecting the colour of a precipitate, reading
from a burette scale, locating the position of a gauge on an analog scale, reading
the figures of a digital display), semi-automatically (when the instrument
provides an informative output such as a spectrum, chromatogram, graph,
signal-time plot, etc., from which data can be extracted for purposes such as
identifying a molecule from its IR spectral bands, measuring the height of a
chromatographic peak or the slope of a kinetic curve) and automatically (when
a computer is used to process one-, two- or three-dimensional information such
as a mass or volume, signal-wavelength or signal-time relations, and signalwavelength-time relations, respectively).
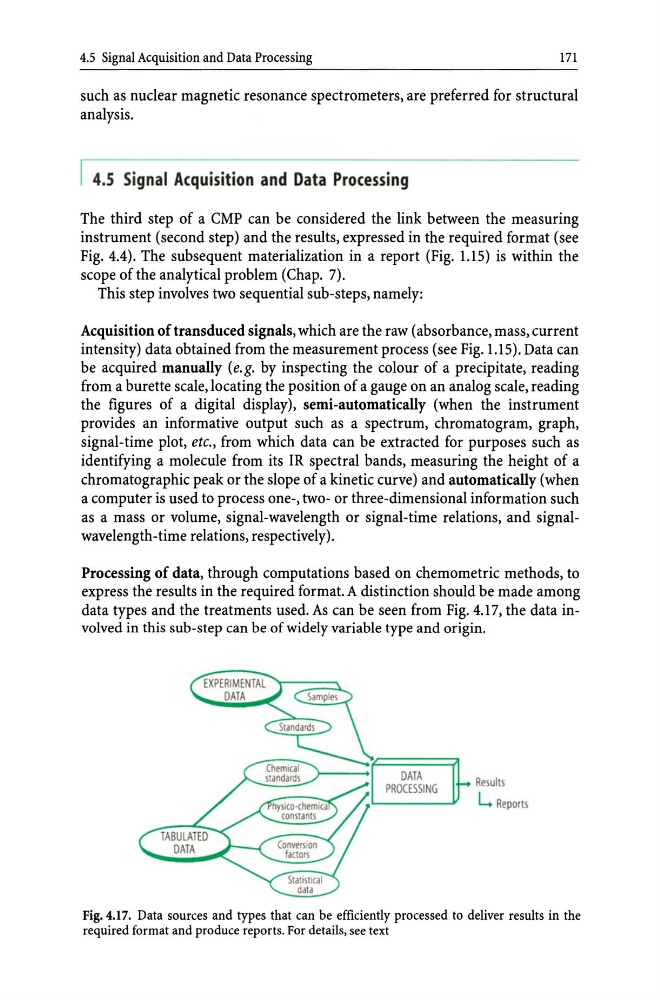
Processing of data, through computations based on chemometric methods, to
express the results in the required format. A distinction should be made among
data types and the treatments used. As can be seen from Fig. 4.17, the data inv01ved in this sub-step can be of widely variable type and origin.
DATA
PROCESSING
Results
L. Reports
Fig.4.17. Data sources and types that can be efficiently processed to deliver results in the
required format and produce reports. For details, see text
171
such as nuclear magnetic resonance spectrometers, are preferred for structural
analysis.
~ Signal Acquisition and Data Processing
The third step of a CMP can be considered the link between the measuring
instrument (second step) and the results, expressed in the required format (see
Fig. 4.4). The subsequent materialization in a report (Fig. 1.15) is within the
scope of the analytical problem (Chap. 7).
This step involves two sequential sub-steps, namely:
Acquisition of transduced signals, which are the raw (absorbance, mass, current
intensity) data obtained from the measurement process (see Fig. 1.15). Data can
be acquired manually (e. g. by inspecting the colour of a precipitate, reading
from a burette scale, locating the position of a gauge on an analog scale, reading
the figures of a digital display), semi-automatically (when the instrument
provides an informative output such as a spectrum, chromatogram, graph,
signal-time plot, etc., from which data can be extracted for purposes such as
identifying a molecule from its IR spectral bands, measuring the height of a
chromatographic peak or the slope of a kinetic curve) and automatically (when
a computer is used to process one-, two- or three-dimensional information such
as a mass or volume, signal-wavelength or signal-time relations, and signalwavelength-time relations, respectively).
Processing of data, through computations based on chemometric methods, to
express the results in the required format. A distinction should be made among
data types and the treatments used. As can be seen from Fig. 4.17, the data inv01ved in this sub-step can be of widely variable type and origin.
DATA
PROCESSING
Results
L. Reports
Fig.4.17. Data sources and types that can be efficiently processed to deliver results in the
required format and produce reports. For details, see text