

98
2 Analytical Properties
• If the analytical blank coincided with the intercept (y = XB = 0.46), and the
standard deviation were the same (a= 0.02), then the relations to sensitivity would
be
3aB
lOaB
CWD = S = 0.03 mg/ml and CWQ = -s- = 0.10 mglmL
(8) In order to determine total calcium in canned orange juice by atomic
absorption spectrometry, a synthetic sample (containing no calcium) was
supplied with increasing concentrations of the analyte. The following absorbance data (together with their uncertainties) were obtained separately
by analysing several samples containing the same analyte concentrations:
[Ca 2 +], 0
0.5
1.0
1.5
2.0
2.5
3.0
4.0
mglL
Absor- 0.040 0.056
0.074
0.090 0.108
0.125
0.152 0.177
bance
(AU)
(0.014) (0.012) (0.010) (0.010) (0.011) (0.11) (0.015)
What is the standard deviation of the blank if the limit of detection for the
method is 0.05 mg/mt?
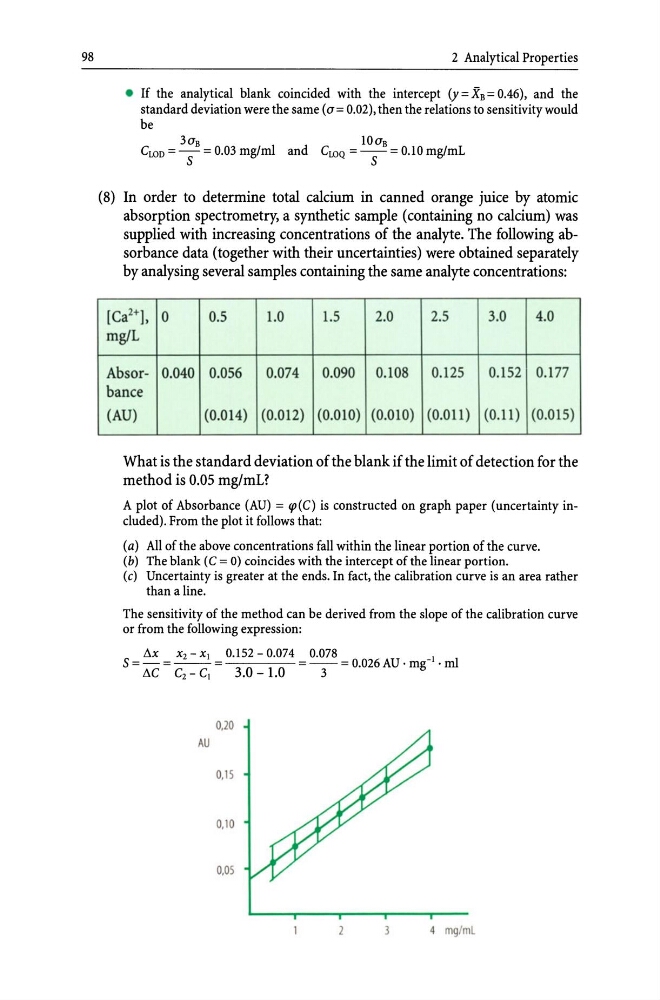
A plot of Absorbance (AU) = qJ(C) is constructed on graph paper (uncertainty included). From the plot it follows that:
(a) All of the above concentrations fall within the linear portion of the curve.
(b) The blank ( C = 0) coincides with the intercept of the linear portion.
(c) Uncertainty is greater at the ends. In fact, the calibration curve is an area rather
than aline.
The sensitivity of the method can be derived from the slope of the calibration curve
or from the following expression:
~X
X2 - XI
0.152 - 0.074 0.078
_I
S = - = - - =
=--=0.026AU·mg · ml
~C
C2 - CI
3.0 - 1.0
3
0.20
AU
0,15
0,10
0.05
4 mg/mL
2 Analytical Properties
• If the analytical blank coincided with the intercept (y = XB = 0.46), and the
standard deviation were the same (a= 0.02), then the relations to sensitivity would
be
3aB
lOaB
CWD = S = 0.03 mg/ml and CWQ = -s- = 0.10 mglmL
(8) In order to determine total calcium in canned orange juice by atomic
absorption spectrometry, a synthetic sample (containing no calcium) was
supplied with increasing concentrations of the analyte. The following absorbance data (together with their uncertainties) were obtained separately
by analysing several samples containing the same analyte concentrations:
[Ca 2 +], 0
0.5
1.0
1.5
2.0
2.5
3.0
4.0
mglL
Absor- 0.040 0.056
0.074
0.090 0.108
0.125
0.152 0.177
bance
(AU)
(0.014) (0.012) (0.010) (0.010) (0.011) (0.11) (0.015)
What is the standard deviation of the blank if the limit of detection for the
method is 0.05 mg/mt?
A plot of Absorbance (AU) = qJ(C) is constructed on graph paper (uncertainty included). From the plot it follows that:
(a) All of the above concentrations fall within the linear portion of the curve.
(b) The blank ( C = 0) coincides with the intercept of the linear portion.
(c) Uncertainty is greater at the ends. In fact, the calibration curve is an area rather
than aline.
The sensitivity of the method can be derived from the slope of the calibration curve
or from the following expression:
~X
X2 - XI
0.152 - 0.074 0.078
_I
S = - = - - =
=--=0.026AU·mg · ml
~C
C2 - CI
3.0 - 1.0
3
0.20
AU
0,15
0,10
0.05
4 mg/mL